Member Services Desk
Weekly Market Update
This MSD Weekly Market Update reflects information for the week ending October 18, 2024.
Economist Views
Click to expand the below image.
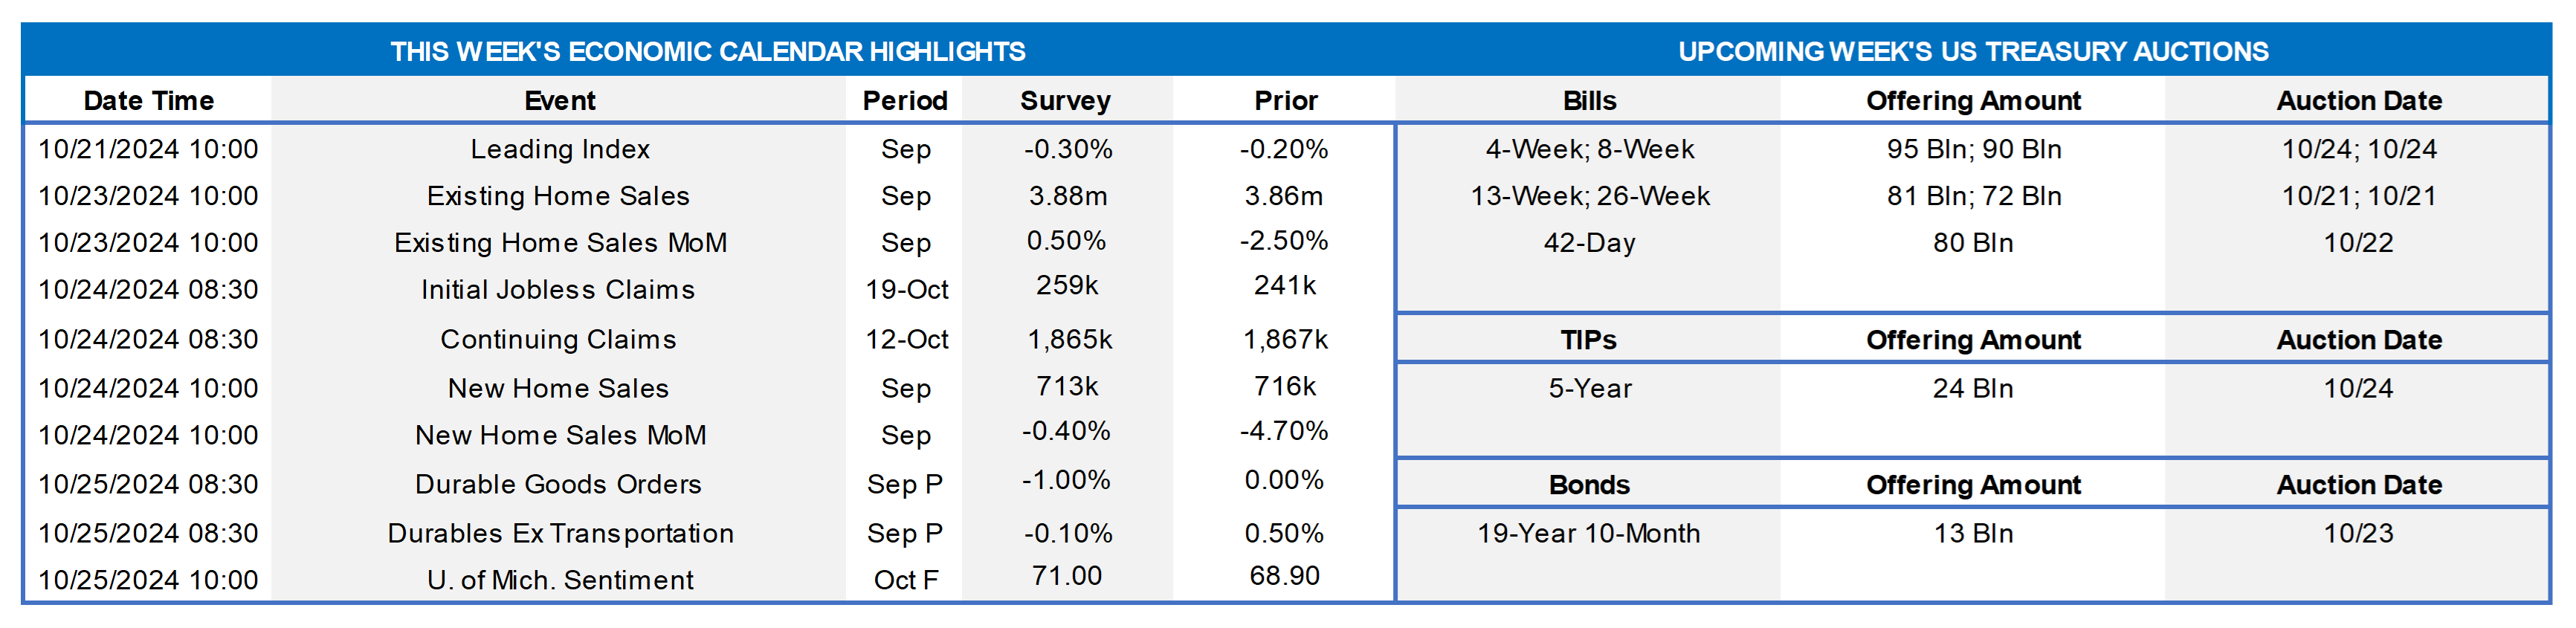
Market participants will contend with a quiet economic release calendar this upcoming week. Existing and new home sales probably were mixed as the Q3 ended, while stepped-up jetliner bookings boosted durable goods orders. The latest readings on initial and continuing jobless claims may provide useful information on the potential impact of recent hurricanes on the upcoming October employment report. Half a dozen Federal Reserve officials, including two current FOMC voters, will speak at a variety of venues.
Leading Indicators: The Conference Board’s gauge of prospective activity is expected to have fallen for a seventh straight month in September, dipping by .3% from August. However, there remains little evidence that the economy is in any danger of faltering. Indeed, a model constructed by the St. Louis Fed estimated that the probability that the economy was in recession in August was a negligible .34%.
Existing Home Sales: A falloff in home-purchase contract signings over the July-August span suggests that existing home sales declined by 1.3% to a 14-year low seasonally adjusted annual rate of 3.81mn in September. With the number of available homes on the market likely to expand by 1.5% to 1.32mn on a not seasonally adjusted basis during the reference period, the supply at the estimated sales pace would move one tick higher to 4.3 months.
Jobless Claims: Reflecting the impacts of recent hurricanes, claims likely remained at elevated levels during their respective reporting periods, hinting at a potentially weak jobs report for October.
New Home Sales: Recent increases in home-purchase mortgage applications suggest that contracts to buy a newly constructed dwelling rebounded by 4.7% to a seasonally adjusted annual rate of 750K in September, reversing all but a fraction of August’s reported decline.
Durable Goods Orders: Reflecting a commercial aircraft-led pullback in transportation equipment bookings, durable goods orders likely declined by 2.3% in September, after virtually no change in the previous month. Net of the anticipated weakness in transportation requisitions, durable goods orders probably moved .1% lower, erasing a portion of August’s .5% gain. Updates on nondefense capital goods shipments, excluding aircraft, will allow economists to update their tracking estimates of real business fixed investment during the summer quarter.
Michigan Sentiment Index: Consumer sentiment likely reversed course over the latter half of October, boosting the final estimate above the weaker-than-expected 68.9 preliminary figure.
Federal Reserve:
- Oct. 21 Dallas Fed President Logan to speak at Securities Industry and Financial Markets Association annual meeting in NYC.
- Oct. 21 Minneapolis Fed Pres Kashkari to participate in a discussion hosted by the Chippewa Falls Chamber of Commerce.
- Oct. 21 Kansas City Fed Pres Schmid to speak to local CFA Society on the economic and monetary policy outlook.
- Oct. 22 Philadelphia Fed President Harker to speak at Eighth Annual Fintech Conference hosted by his bank.
- Oct. 23 Federal Reserve Governor Bowman to give remarks at Philadelphia Fed Fintech Conference.
- Oct. 23 Federal Reserve to release Beige Book summary of commentary on current economic conditions.
- Oct. 24 Cleveland Fed President Hammack to make remarks at event hosted by the Bank’s inflation research center and the ECB.
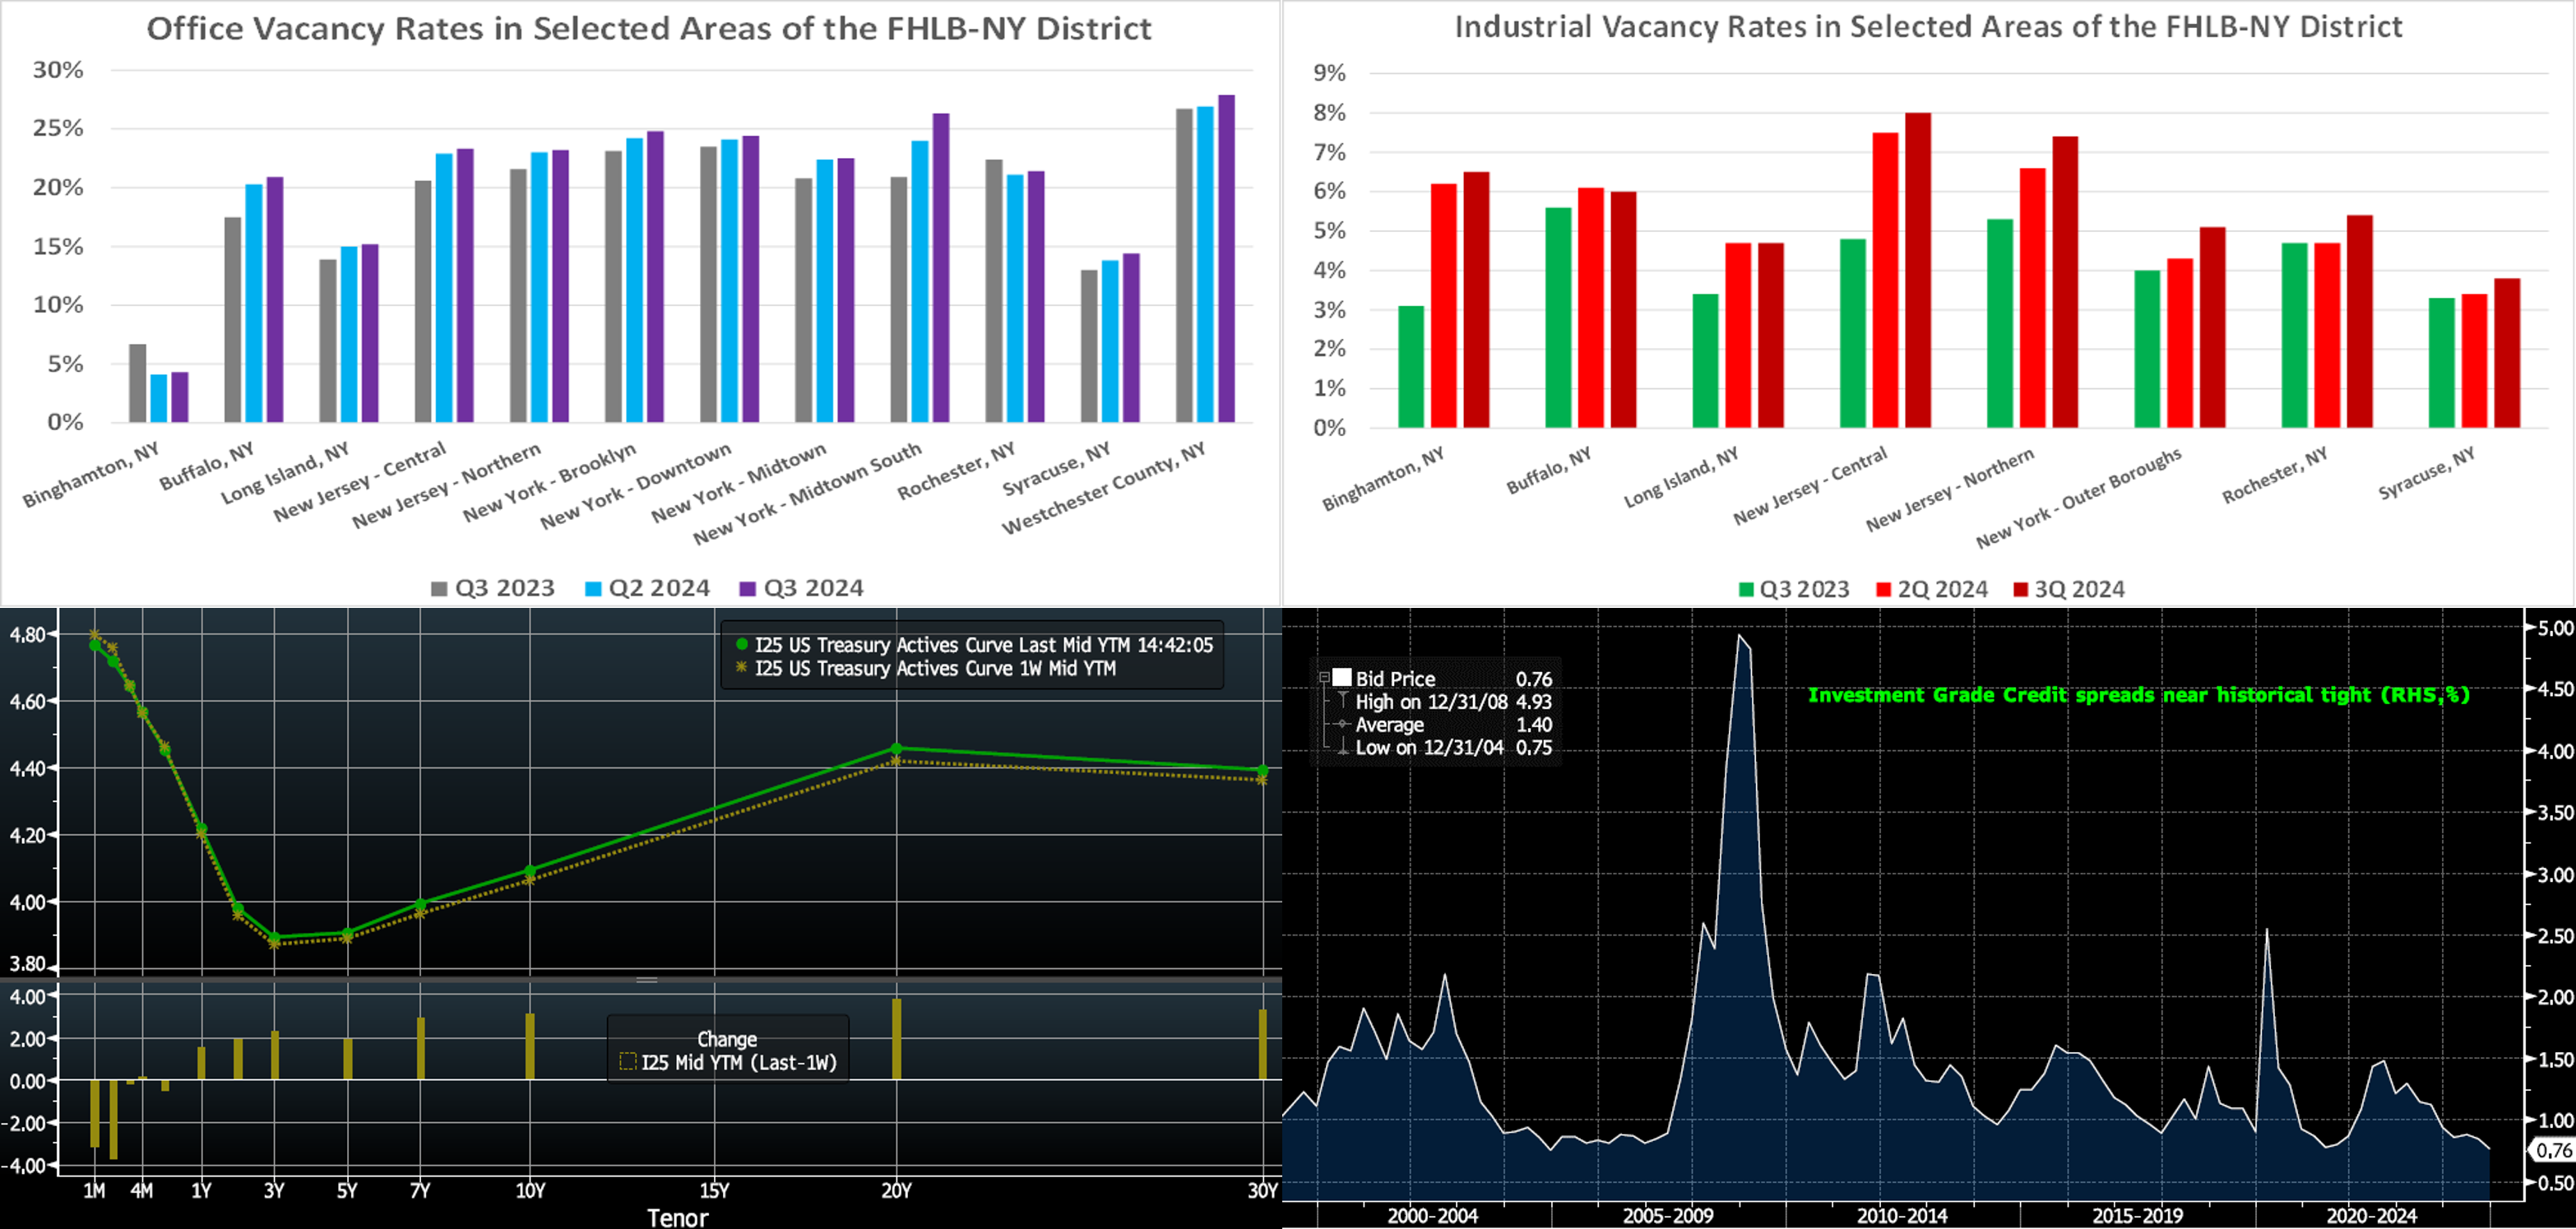
CHART 1 UPPER LEFT and CHART 2 UPPER RIGHT
Source: Cushman & Wakefield; FHLB-NY. Commercial real estate markets remained soft in the FHLB-NY district over the course of the summer quarter. Net absorption of office space across major areas fell by an estimated 4mn square feet over the July-September span, boosting the year-to-date decline to almost 13.2mn square feet. Increases in vacancy rates were universal in Q3 and now range from a low of just 4.3% in Binghamton to a high of 27.9% in Westchester County. Asking rates on average were little changed in Q3 and stand just slightly above those recorded a year ago. The industrial segment, which had been solid following the pandemic, has recently shown signs of faltering. Net absorption of industrial space across major areas contracted by about 3.25mn square feet, after a modest 211.1K dip in Q2. Despite the softening of demand during the reference period, asking rates were generally higher than those prevailing during the spring and previous summer. Reported vacancy rates for industrial space across the FHLBNY district were also higher in Q3, ranging from a low of 3.8% in Syracuse to a high of 8.0% in Central New Jersey.
CHART 3 LOWER LEFT
Source: Bloomberg. Top pane is yield (LHS, %), bottom pane is change (LHS, bps). As of Thursday afternoon, the UST term curve was modestly higher and steeper week-on-week. The 2- and 5-year were ~2 bps higher, while the 10-year rose ~3 bps. Economic data released in the holiday-shortened week was mixed, although Thursday’s retail sales data was notably above consensus expectations. In terms of market-implied pricing of the Fed, for end-2024 the market now prices for Fed Funds ~4.32%, or 3 bps higher than last week and now a tad above the Fed’s latest “dot plot” projection of 4.375%. The market prices end-2025 ~3.36%, or 3 bps lower than last week and which is still roughly in line with the Fed’s median projection of 3.375%.
CHART 4 LOWER RIGHT
Source: Bloomberg. Shown here is the Bloomberg US Aggregate Credit Index Average OAS (option-adjusted spread). The index measures USD-denominated investment grade corporate and foreign agency/supranational-related bond markets. As seen, credit spreads are essentially at the tightest levels of the past 25 years, driven by robust investment flows and a generally healthy economy with sturdy corporate results. The month of September witnessed record-level bond issuance which was easily absorbed. Of note, spreads in this space have tightened to a greater extent than MBS, thereby indicating a possibility of some relative catch-up performance in the latter. MBS spreads have widened in the past month’s rate backup; for instance, the Agency MBS 30-year Current Coupon spread has widened ~20 bps in the past month to a current level of 140 bps.
FHLBNY Advance Rates Observations
Front-End Rates
- Short-end rates were lower by 1 to 5 bps week-over-week, with the 1 to 4-month tenors leading the decline. Net T-bill issuance has been increasing, but sturdy demand for short-end paper has and should limit any serious impact on issuance spreads; this dynamic has been reinforced by robust Money Market Fund AUM levels.
- The market will monitor data and a plethora of Fedspeak in the upcoming week. Q3 earnings reports, including from banks, should continue to hit the news.
Term Rates
- The longer-term curve, generally mirroring moves in USTs and swaps, was modestly changed from a week ago. Most tenors were unchanged or a bp lower. Kindly refer to the previous section for on market dynamics and changes. We encourage members to engage with the Member Services Desk for current rate levels and market dynamics.
- On the UST term supply front, the upcoming week serves a 20-year nominal and a 5-year TIPS auction. Note that UST auctions usually occur at 1pm and can occasionally spur volatility around that time. Please contact the Member Services Desk for further information on market dynamics, rate levels, or products. Note that our “800 number” is again ready for use at 1-800-546-5101 option 1.
Price Incentives for Advances Executed Before Noon: In effect as of Tuesday, September 5, 2023, the FHLBNY is pleased to now offer price incentives for advances executed before Noon each business day. These pricing incentives offer an opportunity to provide economic value to our members, while improving cash and liquidity management for the FHLBNY. For further details, kindly refer to the Bulletin.
The Symmetrical Prepayment Advance Feature
For those anticipating term funding needs, and with rates on an uptrend, it can be an appropriate juncture to consider our SPA feature. This feature allows the member to capture, at prepayment, changes in the fair value of the advance which are favorable to the member. Contact Member Services Desk to discuss.
Looking for more information on the above topics? We’d love to speak with you!
Questions?
If you wish to receive the MSD Weekly Market Update in .pdf format (includes FHLBNY rate charts) or to discuss this content further, please email the MSD Team.