Member Services Desk
Weekly Market Update
This MSD Weekly Market Update reflects information for the week ending October 11, 2024.
Economist Views
Click to expand the below image.
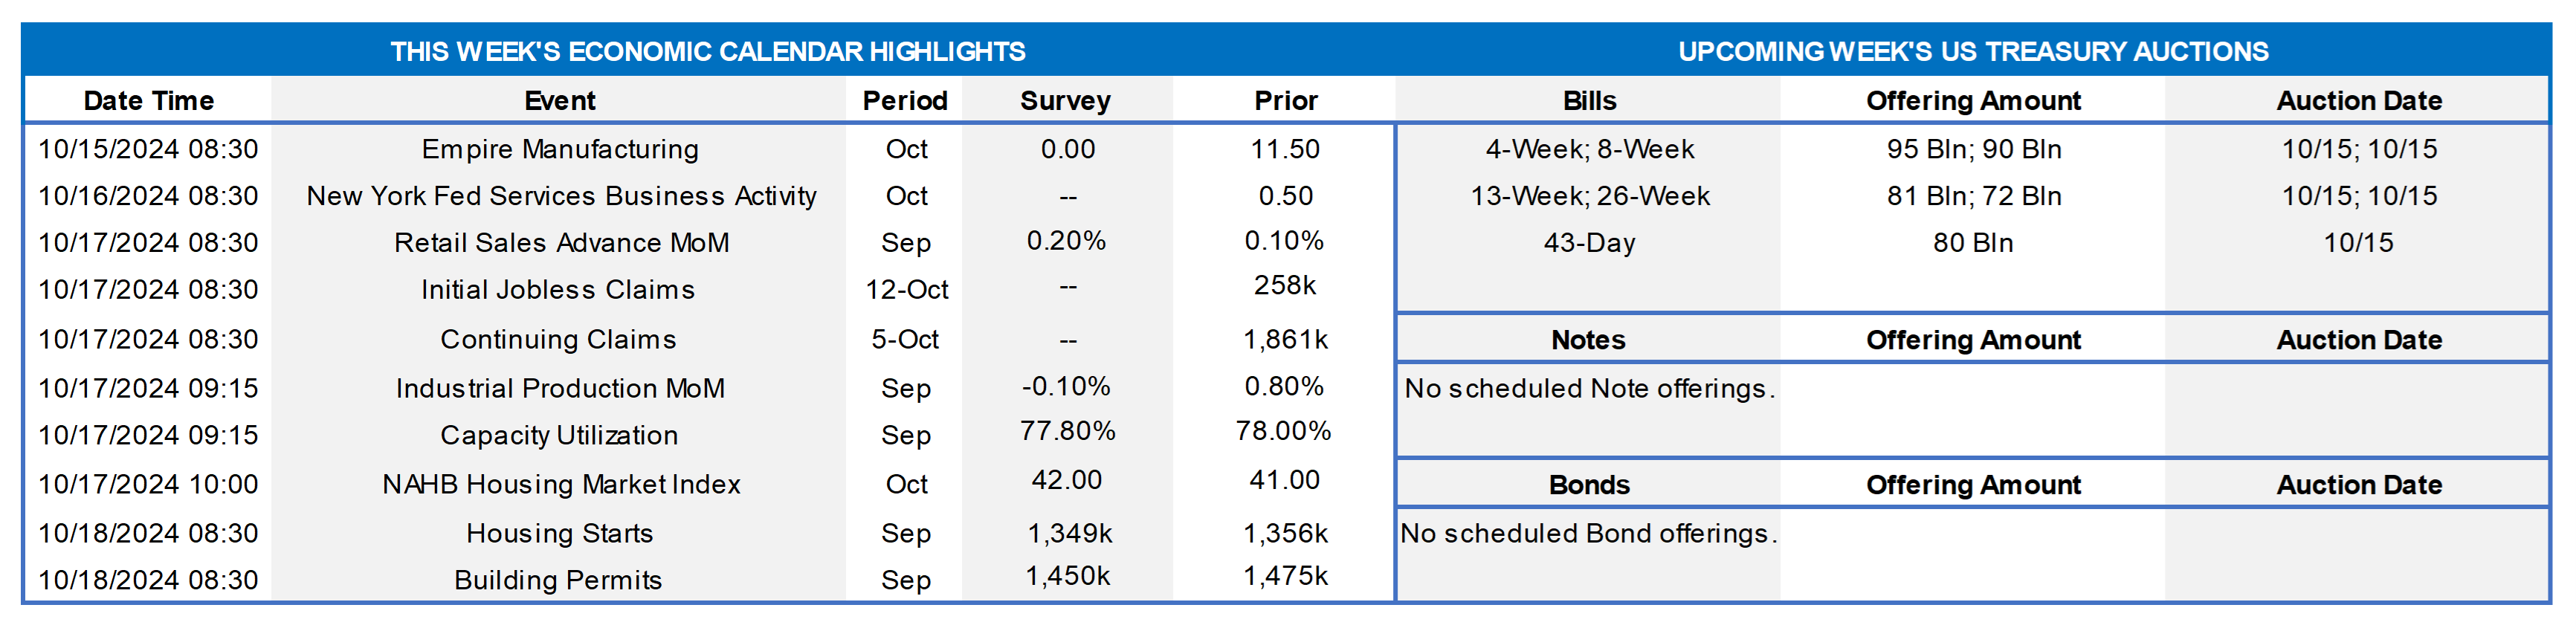
With employment and consumer inflation updates for September now in the past, market participants will monitor key inputs into Q3 real GDP growth tracking estimates. Retail sales likely quickened as the summer ended, hinting at upward adjustments to consumer spending forecasts. By contrast, weaker soundings on industrial production and new residential construction activity may prompt haircuts to current investment-spending projections. While the median Street projection currently calls for a near-trend 2% annualized rise in real GDP growth in Q3, more thorough forecasts from the Federal Reserve Banks of Atlanta and New York envision no slowdown from the spring quarter’s 3% annualized clip. This week’s jobless claims report will also be watched closely to gauge the impacts of recent hurricanes on employment data. A trio of Federal Reserve officials, including two current FOMC voters, are scheduled to provide comments during the holiday-shortened week.
Empire State Manufacturing Survey: The expansion in manufacturing activity in New York State likely continued in early October, although the breadth of reported gains may narrow from September’s clip. The general business conditions diffusion index – the net percentage of survey respondents noting a pickup in activity less those experiencing a decline – probably retreated to 5% from the 11.5% posted in the prior month.
New York Fed Services Survey: Service-producing activity across New York, northern New Jersey, and western Connecticut probably rose in early October, with the current business activity diffusion index improving to 5% from .5% in September.
Retail & Food Services Sales: Buoyed by an anticipated rebound in auto-dealer revenues, sales probably climbed by .6% in September, after a modest .1% gain in August. Excluding a projected 2.3% increase in vehicle sales during the reference period, retail purchases likely rose by .2%, eclipsing the .1% prior-month uptick. As always, watch the so-called “control” sales excluding auto, building materials, and gas purchases in this week’s report for clues to the pace of Q3 consumer spending. Barring any prior-month revisions, the consensus .3% increase would place core purchases over the July-September span a solid 5.8% annualized above their April-June average, thereby eclipsing Q2’s 3.2% annualized gain.
Jobless Claims: Reflecting the devastating impacts of Hurricanes Helene and Milton, both initial and continuing jobless claims likely remained at elevated levels during their respective reporting periods and thereby would hint at a potentially weak employment report for October.
Industrial Production & Capacity Utilization: Pared by an anticipated dip in factory output, industrial production likely declined by .3% in September, reversing almost half of August’s .8% gain. With additions to productive capacity expected to exceed output during the reference period, the capacity utilization rate probably moved four ticks lower to 77.6%.
NAHB Housing Market Index: Buoyed by lower rates, the sentiment gauge may have returned to the breakeven 50 level in October, after the 41 reading recorded in the prior month.
Housing Starts & Building Permits: Adversely impacted by the effects of Hurricanes Francine and Helene, new housing units started and building permits issued likely retreated from the respective annualized rates of 1.36mn and 1.47mn witnessed in August.
Federal Reserve:
- Oct. 14 Federal Reserve Governor Christopher Waller speaks on the economic outlook at an event in Stanford, CA.
- Oct. 15 San Francisco Fed President Daly to make opening remarks followed by a conversation at NYU Business School.
- Oct. 18 Minneapolis Fed Pres Kashkari to speak at a policy conference hosted by his bank, the University of Chicago, and Stanford.
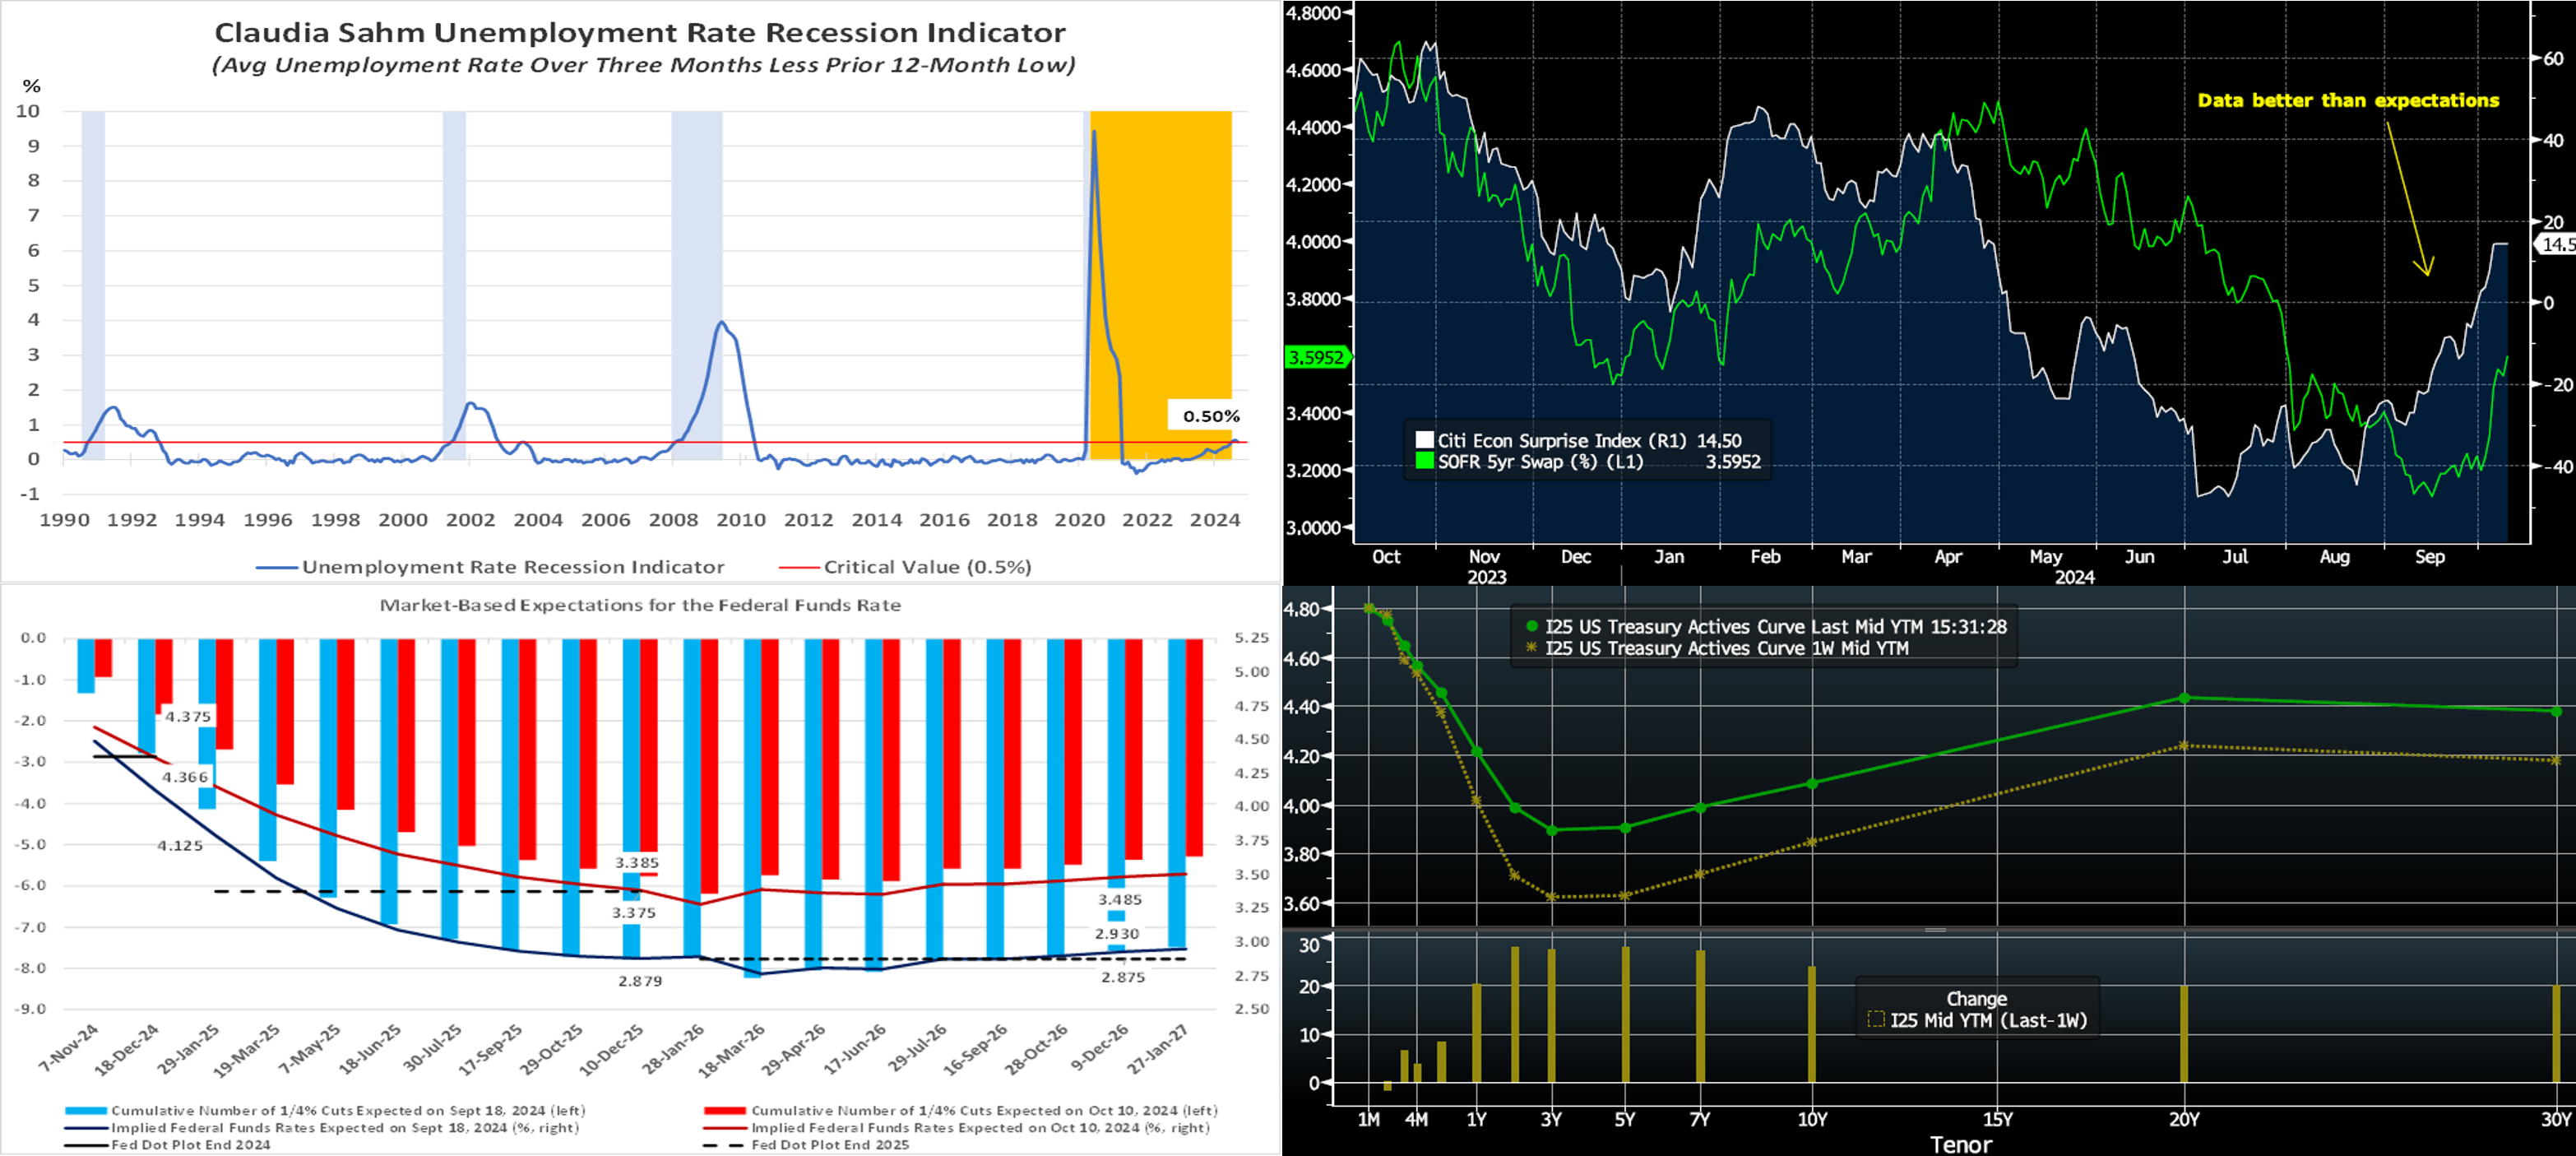
CHART 1 UPPER LEFT
Source: Bureau of Labor Statistics; Federal Reserve Bank of St. Louis; National Bureau of Economic Research; FHLB-NY. Notes: Blue-shaded areas denote recessions; orange-area highlights current economic expansion. Last Friday’s September employment report went a long way in allaying fears of an impending marked deterioration in labor market conditions. Not only did payroll employment growth quicken to a six-month high of 254K jobs, but the civilian unemployment rate also dipped for a second straight month to 4.1%. Most importantly, the labor-market recession metric developed by former Federal Reserve Economist Claudia Sahm – the average unemployment rate over the latest three months less its prior 12-month low – returned to its breakeven level of 0.5% and actually registered at 0.48% on an unrounded basis.
CHART 2 UPPER RIGHT
Source: Bloomberg. Much like the employment situation report cited above, economic data in general over the past month has registered at better-than-expectations levels, as seen here in the recent rise of the Citibank Economic Surprise Index (White, RHS). This dynamic has, in turn, instigated a backup in rates, as seen here in the 5-year SOFR swap rate (LHS, %), which has risen ~45 bps since mid-September. Note that data can beat expectations for a mix of reasons; for instance, the data may be truly robust, or economists may be marking forecasts lower, or perhaps a bit of both.
CHART 3 LOWER LEFT
Source: Bloomberg; FHLB-NY. As a result of this sturdier data and economic backdrop, the market has pared back its pricing of rate cuts, as seen here in the forward curve now vs. that of three weeks ago. The market has essentially “taken out” 25 bps of easing for the rest of 2024. For end-2025, ~50 bps of cumulative easing has been priced out of the curve, and the market essentially prices no further easing after that point. Interestingly, the market now prices roughly in accordance with the Fed’s latest dot plot through 2026, and it now prices ~50 bps higher than the “dot plot” beyond that point. For the past year, the market usually priced more aggressive cuts than the Fed forecasts and a more aggressive timeline than what has since unfolded; in this light, the current market pricing proves notable and more in line with a gradual “see as we go” timeline that recent Fedspeak has espoused.
CHART 4 LOWER RIGHT
Source: Bloomberg. Top pane is yield (LHS, %), bottom pane is change (LHS, bps). As of Thursday afternoon, the UST term curve, led by the belly, was notably higher week-on-week. The 5-year was ~28 bps higher, for instance. Economic data released in the past week was generally conducive to a yield backup, and Fedspeak leaned towards a “see as we go” approach on rate cuts, as mentioned above. In terms of market-implied pricing of the Fed, for end-2024 the market now prices for Fed Funds at 4.39%, 23 bps higher than last week, and is now roughly in line with the Fed’s latest “dot plot” projection of 4.375%. The market prices end-2025 ~3.39%, 37 bps higher than last week and which is also now in line with the Fed’s median projection of 3.375%.
FHLBNY Advance Rates Observations
Front-End Rates
- Short-end rates were mixed and the curve steeper week-over-week. While 1-month-and-in tenors declined by 3 to 6 bps, the 2-month-and-out sector was higher by 1 to 8 bps in steepening fashion. Solid demand for and tighter spreads on our paper prompted the decline in shorter rates, while the market’s repricing Fed cuts led to the higher rates 2-month-and-out. Net T-bill issuance, now well past the mid-September corporate tax date, is on the rise again, but sturdy demand for short-end paper should limit any serious impact on our issuance spreads; this dynamic is reinforced by robust Money Market Fund AUM levels.
- The market will monitor data and Fedspeak in the upcoming holiday-shortened week. Q3 earnings reports, including from banks, should also be hitting the news.
Term Rates
- The longer-term curve, generally mirroring moves in USTs and swaps, was higher by 25 to 28 bps from a week ago. The rise in rates has quieted interest in longer tenor advances, at least for the moment. Kindly refer to the previous section for color on market dynamics and changes. We encourage members to engage with the Member Services Desk for current rate levels and market dynamics.
- On the UST term supply front, the upcoming week serves a reprieve from auctions. Note that UST auctions usually occur at 1pm and can occasionally spur volatility around that time. Please contact the Member Services Desk for further information on market dynamics, rate levels, or products. Note that our “800 number” is again ready for use at 1-800-546-5101 option 1.
Price Incentives for Advances Executed Before Noon: In effect as of Tuesday, September 5, 2023, the FHLBNY is pleased to now offer price incentives for advances executed before Noon each business day. These pricing incentives offer an opportunity to provide economic value to our members, while improving cash and liquidity management for the FHLBNY. For further details, kindly refer to the Bulletin.
The Symmetrical Prepayment Advance Feature
For those anticipating term funding needs, and with rates on an uptrend, it can be an appropriate juncture to consider our SPA feature. This feature allows the member to capture, at prepayment, changes in the fair value of the advance which are favorable to the member. Contact Member Services Desk to discuss.
Looking for more information on the above topics? We’d love to speak with you!
Questions?
If you wish to receive the MSD Weekly Market Update in .pdf format (includes FHLBNY rate charts) or to discuss this content further, please email the MSD Team.