Member Services Desk
Weekly Market Update
This MSD Weekly Market Update reflects information for the week ending October 4, 2024.
Economist Views
Click to expand the below image.
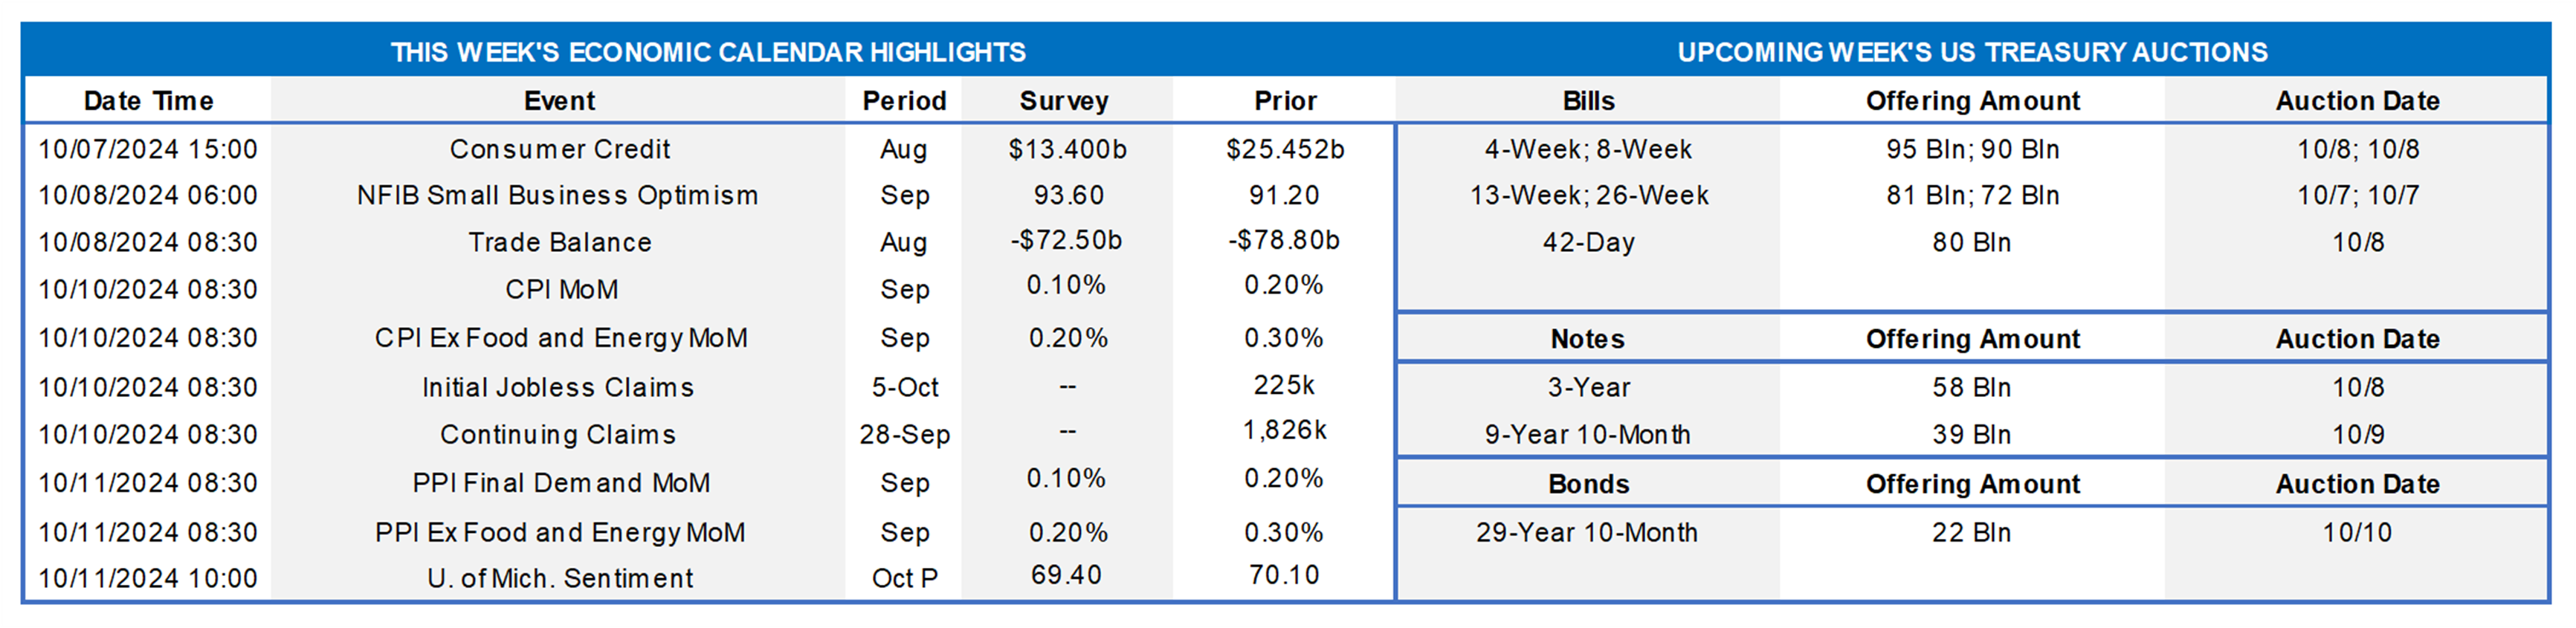
With the September employment report in the rear-view mirror, the market will turn its attention to the inflation side of the Fed’s dual mandate. Consumer price inflation (CPI) is expected to have slowed last month, bringing overall and core gauges on a year-to-year basis closer to the central bank’s desired 2% target. Small business confidence probably ended the summer on an upbeat note, while consumer sentiment improved during the first two weeks of October. A narrowing of the international trade gap in August may prompt economists to boost their tracking estimates for Q3 real GDP growth from the current 2% annualized median projection. Jobless claims likely remained little changed in a range associated with healthy labor market conditions. A steady stream of public appearances by Federal Reserve officials is also on offer in the upcoming week.
Consumer Credit: Consumer installment credit growth likely slowed in August, rising by an estimated $12.7bn after the nearly two-year high $25.5bn takedown posted in July.
NFIB Small Business Optimism Index: The gauge probably remained on a saw-toothed path in September, rebounding to 92.5 from 91.2 in the preceding month.
International Trade Balance: Prompted by a sharp reduction in the merchandise trade gap, the deficit in goods and services likely narrowed to a five-month low of $71bn in August from the $78.8bn shortfall witnessed in the prior month.
Consumer Prices: Capped by lower gas prices, CPI probably edged .1% higher, following a pair of .2% upticks in July and August. Excluding volatile food and energy costs, the core CPI is expected to have risen by .2% after a surprisingly large .3% increase in the prior month. Those projections, if realized, would place the overall and core CPIs 2.3% and 3.1% above their respective year-ago levels.
Jobless Claims: Initial claims for unemployment insurance benefits likely remained in a 220K to 235K range during the filing period ended September 28. Watch continuing claims, which have been retreating over the past three weeks, for signs that recently furloughed employees may be having an easier time finding work.
Producer Prices: Echoing the anticipated deceleration in consumer goods and services costs in September, producer-price inflation probably moderated as well as Q3 ended.
Michigan Sentiment Index: Rosier appraisals of economic conditions probably lifted the U of M’s consumer barometer to a six-month high of 72.5 in early October from 70.1 in the previous month.
Federal Reserve:
- Oct. 7 Minneapolis Fed President Kashkari to participate in a Q&A at an event hosted by the Bank Holding Company Assn.
- Oct. 7 St. Louis Fed President Musalem to give a speech on the US economy and monetary policy.
- Oct. 8 Boston Fed President Collins to provide remarks at the 23rd annual Regional & Community Bankers Conference.
- Oct. 9 Atlanta Fed President Bostic to give welcome remarks at the Greater Atlanta Home Builders Association meeting.
- Oct. 9 Dallas Fed President Lorie Logan to speak at the Greater Houston Partnership Future of Global Energy Conference.
- Oct. 9 Minutes of Sept. 17-18 Federal Open Market Committee meeting to be released.
- Oct. 9 Boston Fed President Collins to speak at the Worcester Regional Research Bureau’s 39th Annual Meeting.
- Oct. 10 New York Fed President John Williams to give keynote remarks at Binghamton University.
- Oct. 11 Chicago Fed President Goolsbee to gives opening remarks at the Community Bankers Symposium.
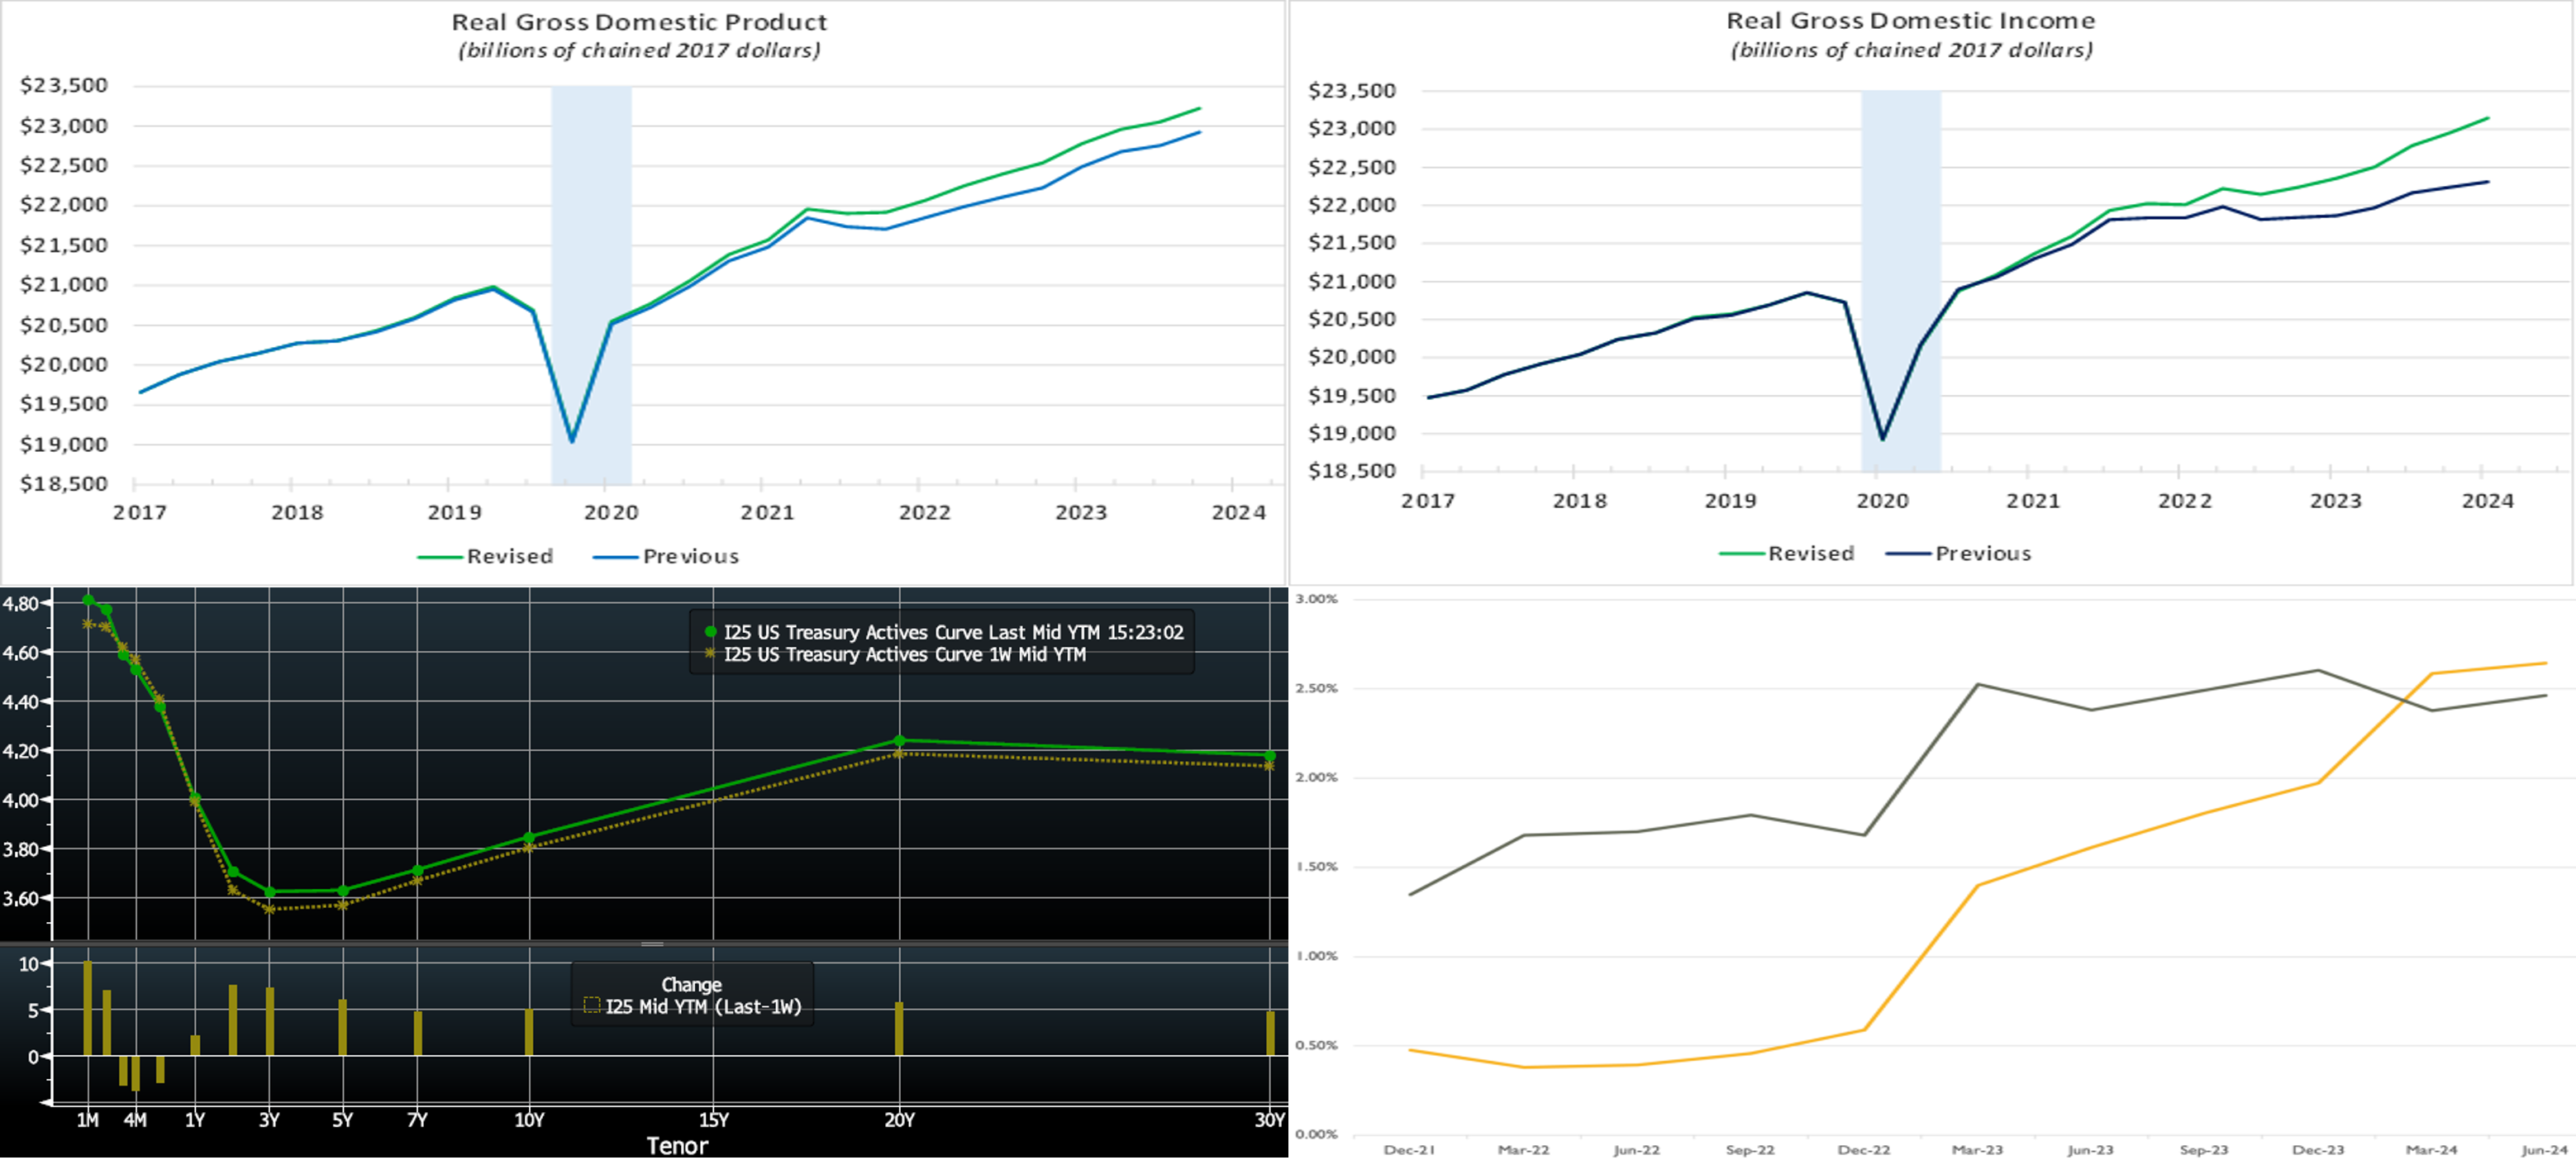
CHART 1 UPPER LEFT and CHART 2 UPPER RIGHT
Source: Bureau of Economic Analysis; FHLB-NY. As seen in this pair of companion charts, late last week’s Gross Domestic Product (GDP) report contained important upward adjustments to real National Product & Income Account data. Average annualized growth in real GDP from Q1-2019 to Q2-2024 was revised higher from 2.2% to 2.5%. Even larger upward revisions were applied to real Gross Domestic Income (GDI). Average annualized growth in real GDI over this period, driven by large upward adjustments to the latest four quarters, was revised higher to a hefty 2.7%, up from the 1.7% previous estimate. The average growth rate for real GDI in the last four quarters now stands at 3.5% compared to just 2.0% previously. Moreover, the statistical discrepancy of real GDP less real GDI, at a record $616bn (2017 dollars) previously, has now been revised tighter, to just $77.3bn. In theory, the GDP and GDI figures should equal each other, but source data can sometimes yield varying results. The latest revisions, therefore, put a sizable dent in the previous discrepancy.
CHART 3 LOWER LEFT
Source: Bloomberg. Top pane is yield (LHS, %), bottom pane is change (LHS, bps). As of Thursday afternoon, the UST term curve was higher and slightly flatter week-on-week. While the 2-year was ~7 bps higher, the 5-year was ~6 bps higher. Economic data released this past week was again generally better than consensus expectations. However, the market was somewhat marking time until the “first-tier” unemployment situation report was released Friday, the morning after this writing. In terms of market-implied pricing of the Fed, for end-2024, the market now prices for Fed Funds at 4.16%, 6 bps higher than last week but still below the Fed’s latest “dot plot” projection of 4.375%. The market prices end-2025 ~3.02%, ~10 bps higher than last week, and which is also still below the Fed’s projection of 3.375%; the market, in sum, “agrees” with the Fed’s long-run median projection on Fed Funds ~2.875% but prices the Fed to act in much quicker fashion to get there.
CHART 4 LOWER RIGHT
Source: The Bank Treasury Newsletter; Call Reports All Commercial Banks, FIS FedFis LLC. The decline in term yields of the past few months, subsequently followed by the recent Fed rate cut, may bring some relief to banks’ underwater bond portfolios and related NIM pressures. Shown here, in the banking industry aggregate, is the trend over recent years in Cost of Funds (LHS, gold, %) and Book Yield on Agency MBS (LHS, black, %). Owing to high deposit and liquidity levels, in tandem with low loan-to-deposit ratios, back in 2018-21, many banks added to their securities portfolios. While at the time, the spreads were attractive and accretive to NIM, the environment changed drastically with the subsequent Fed hiking cycle and backup in rates. For context, the 30-year MBS Current Coupon rose from ~1.20% in July 2020 to as high as 6.88% in October 2023, and the result was a severe decline in the prices of existing bonds. But the overall situation may be improving. Firstly, the decline in yields in recent months will help prices on existing portfolios; of note, the Current Coupon currently trades ~5.00%, well below a year ago. Secondly, bond cashflows can continue to be invested at higher yields than a few years ago. And thirdly, the Fed cut rates by 50 bps a few weeks ago and more cuts may be forthcoming, and so Cost of Funds may have topped out at this juncture and potentially decline in the quarters ahead. As the chart data here is through June 2024, perhaps a more optimistic view lies ahead in future quarters.
FHLBNY Advance Rates Observations
Front-End Rates
- Short-end rates were mixed week-over-week. The shortest tenors 1-month-and-in were higher by 8 to 11 bps. The 2-month-and-out tenors, however, varied from only a few bps higher to finishing relatively unchanged. Upward pressure on the shortest maturities was a result of market dynamics from quarter-end and UST settlements. Net T-bill issuance, now well past the mid-September corporate tax date, is on the rise again, but sturdy demand for short-end paper should limit serious impact on our issuance spreads, especially given ongoing robust Money Market Fund AUM levels.
- The market will monitor data and a plethora of Fedspeak in the upcoming week.
Term Rates
- The longer-term curve, generally mirroring moves in USTs and swaps, was higher and slightly flatter from a week ago. The 2-year was ~8 bps higher, and the 5-year rose by ~ 6 bps. Kindly refer to the previous section for color on market dynamics and changes. We encourage members to engage with the Member Service Desk for current rate levels and market dynamics.
- On the UST term supply front, the upcoming week serves a hefty slate of 3/10/30-year auctions. Note that UST auctions usually occur at 1pm and can occasionally spur volatility around that time. Please contact the Member Service Desk for further information on market dynamics, rate levels, or products. Note that our “800 number” is again ready for use at 1-800-546-5101 option 1.
Price Incentives for Advances Executed Before Noon: In effect as of Tuesday, September 5, 2023, the FHLBNY is pleased to now offer price incentives for advances executed before Noon each business day. These pricing incentives offer an opportunity to provide economic value to our members, while improving cash and liquidity management for the FHLBNY. For further details, kindly refer to the Bulletin.
The Symmetrical Prepayment Advance Feature
For those anticipating term funding needs, and with rates on an uptrend, it can be an appropriate juncture to consider our SPA feature. This feature allows the member to capture, at prepayment, changes in the fair value of the advance which are favorable to the member. Contact Member Services Desk to discuss.
Looking for more information on the above topics? We’d love to speak with you!
Questions?
If you wish to receive the MSD Weekly Market Update in .pdf format (includes FHLBNY rate charts) or to discuss this content further, please email the MSD Team.