Member Services Desk
Weekly Market Update
This MSD Weekly Market Update reflects information for the week ending September 27, 2024.
Economist Views
Click to expand the below image.
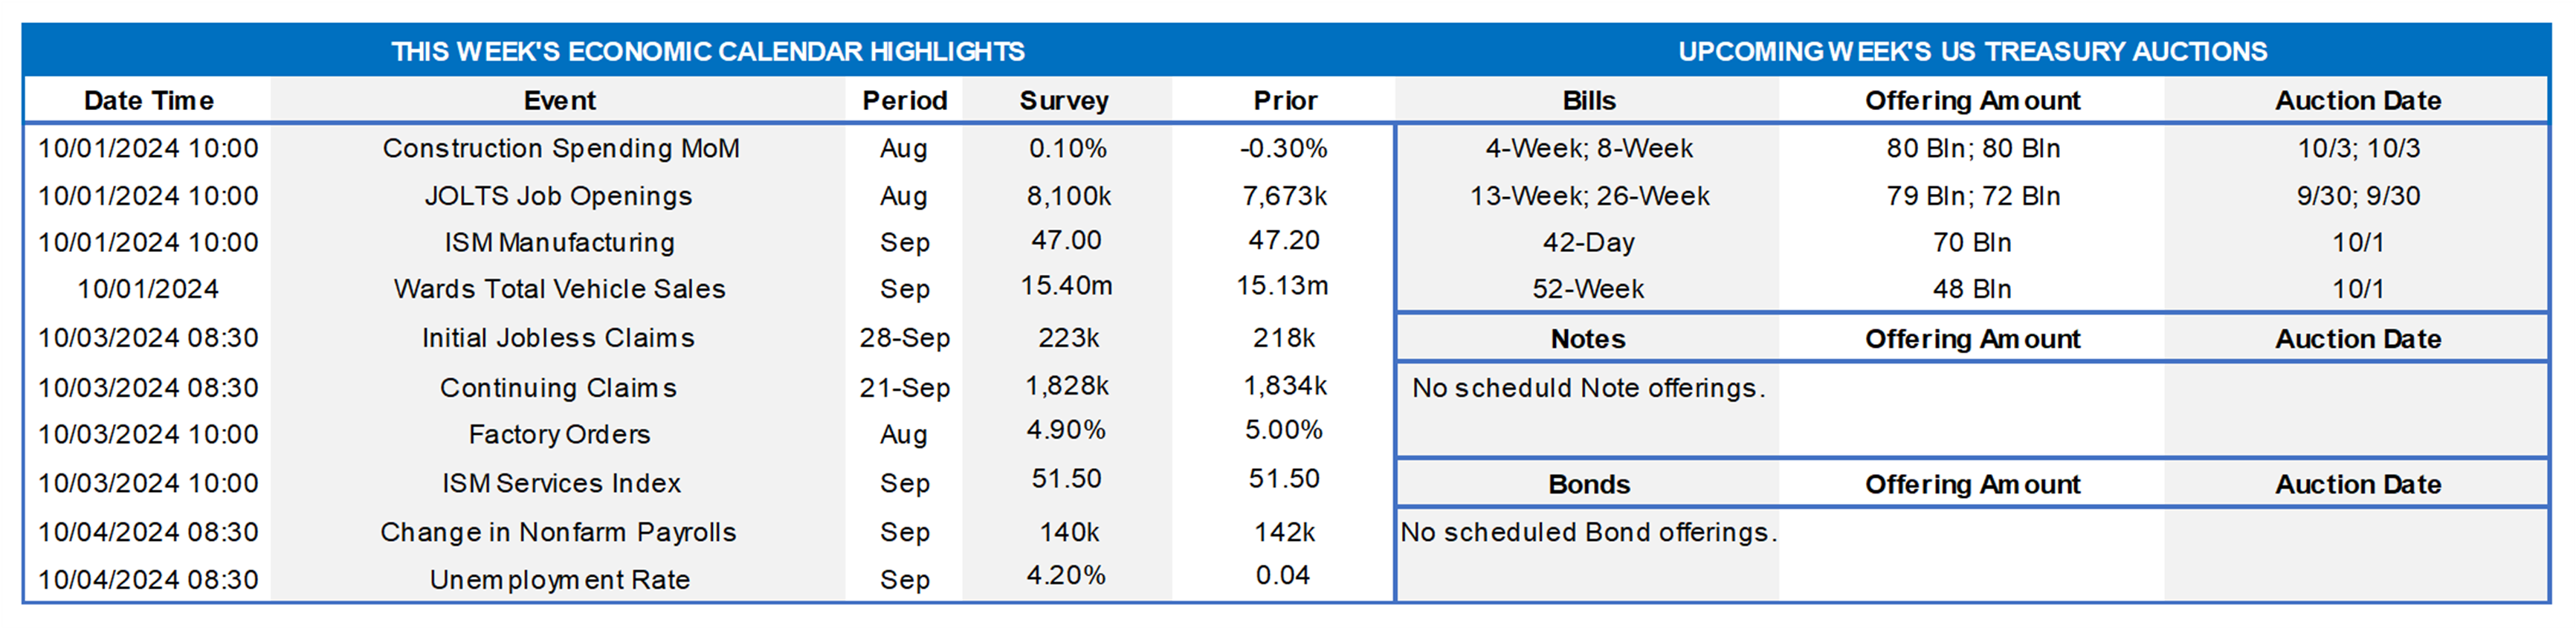
Market participants will contend with a busy calendar of economic reports and public appearances by Fed officials in the week ahead. With policymakers now focused squarely on the labor side of the central bank’s dual mandate, the employment situation report for September will be the marquee release. The pace of net hiring likely was little changed as the summer ebbed, with the unemployment rate expected to hold at its reported August level. Allaying fears surrounding a more serious deterioration in labor market conditions, job openings probably returned to the 8mn mark in August. Manufacturing is expected to contract once again in September, while service-producing activity witnessed a significant pickup. A steady stream of Fed officials are slated to give their views on a variety of timely topics.
Construction Spending: The nominal value of new construction put-in-place probably rebounded in August, erasing July’s 0.3% decline.
ISM Manufacturing Activity Index: Available canvasses suggest that the activity gauge contracted for a sixth straight month in September, dipping slightly to 47% from 47.2% in August.
JOLTS Job Openings: A reported rebound in online help-wanted postings suggests that nationwide job openings jumped by 335K to a three-month high of 8mn in August. At an estimated 890K, the excess of vacant positions nationwide would represent 1.13 jobs per unemployed person.
Motor Vehicle Sales: Sales of light trucks and passenger cars likely remained on a saw-toothed path in September, rebounding by 2.7% to a seasonally adjusted annual rate of 15.5mn.
Jobless Claims: Initial claims for unemployment insurance benefits likely remained in a 220K to 235K range during the filing period ended September 28. Watch continuing claims, which have been retreating over the past three weeks, for signs that recently furloughed employees may be having an easier time finding work.
ISM Services Activity Index: The expansion in activity probably gathered considerable steam in September, with the ISM’s barometer climbing to a 13-month high of 54% from 51.5% in August.
Employment Situation Report: Buoyed by favorable weather conditions, nonfarm payrolls likely expanded by 150K in September, marginally eclipsing the 142K August gain. The unemployment rate probably held steady at 4.2% during the reference period, leaving the summer-quarter average at a level triggering a Sahm-Rule potential recession warning. With the establishment survey period failing to include the 15th of the month in September, average hourly may disappoint vis-à-vis the median Street call for a .3% gain.
Federal Reserve:
- Sept. 30 Fed Chair Powell to give luncheon address at the National Association for Business Economics conference in Nashville, TN.
- Oct. 1 Atlanta Fed President Bostic to provide opening remarks at FRB-organized technology-enabled disruption conference.
- Oct. 1 Atlanta Fed President Bostic to moderate a conversation with Fed Governor Cook at above FRB-organized conference.
- Oct. 1 Atlanta Fed President Bostic, Richmond Fed’s Barkin, and Boston Fed’s Collins to have panel discussion at above conference.
- Oct. 2 St. Louis Fed President Musalem to give welcoming remarks at a community banking research conference.
- Oct. 2 Fed Governor Michelle Bowman to give keynote speech at the Community Banking Research Conference.
- Oct. 3 Minneapolis Fed President Kashkari to have talk with Atlanta Fed President Bostic about an inclusive economy.
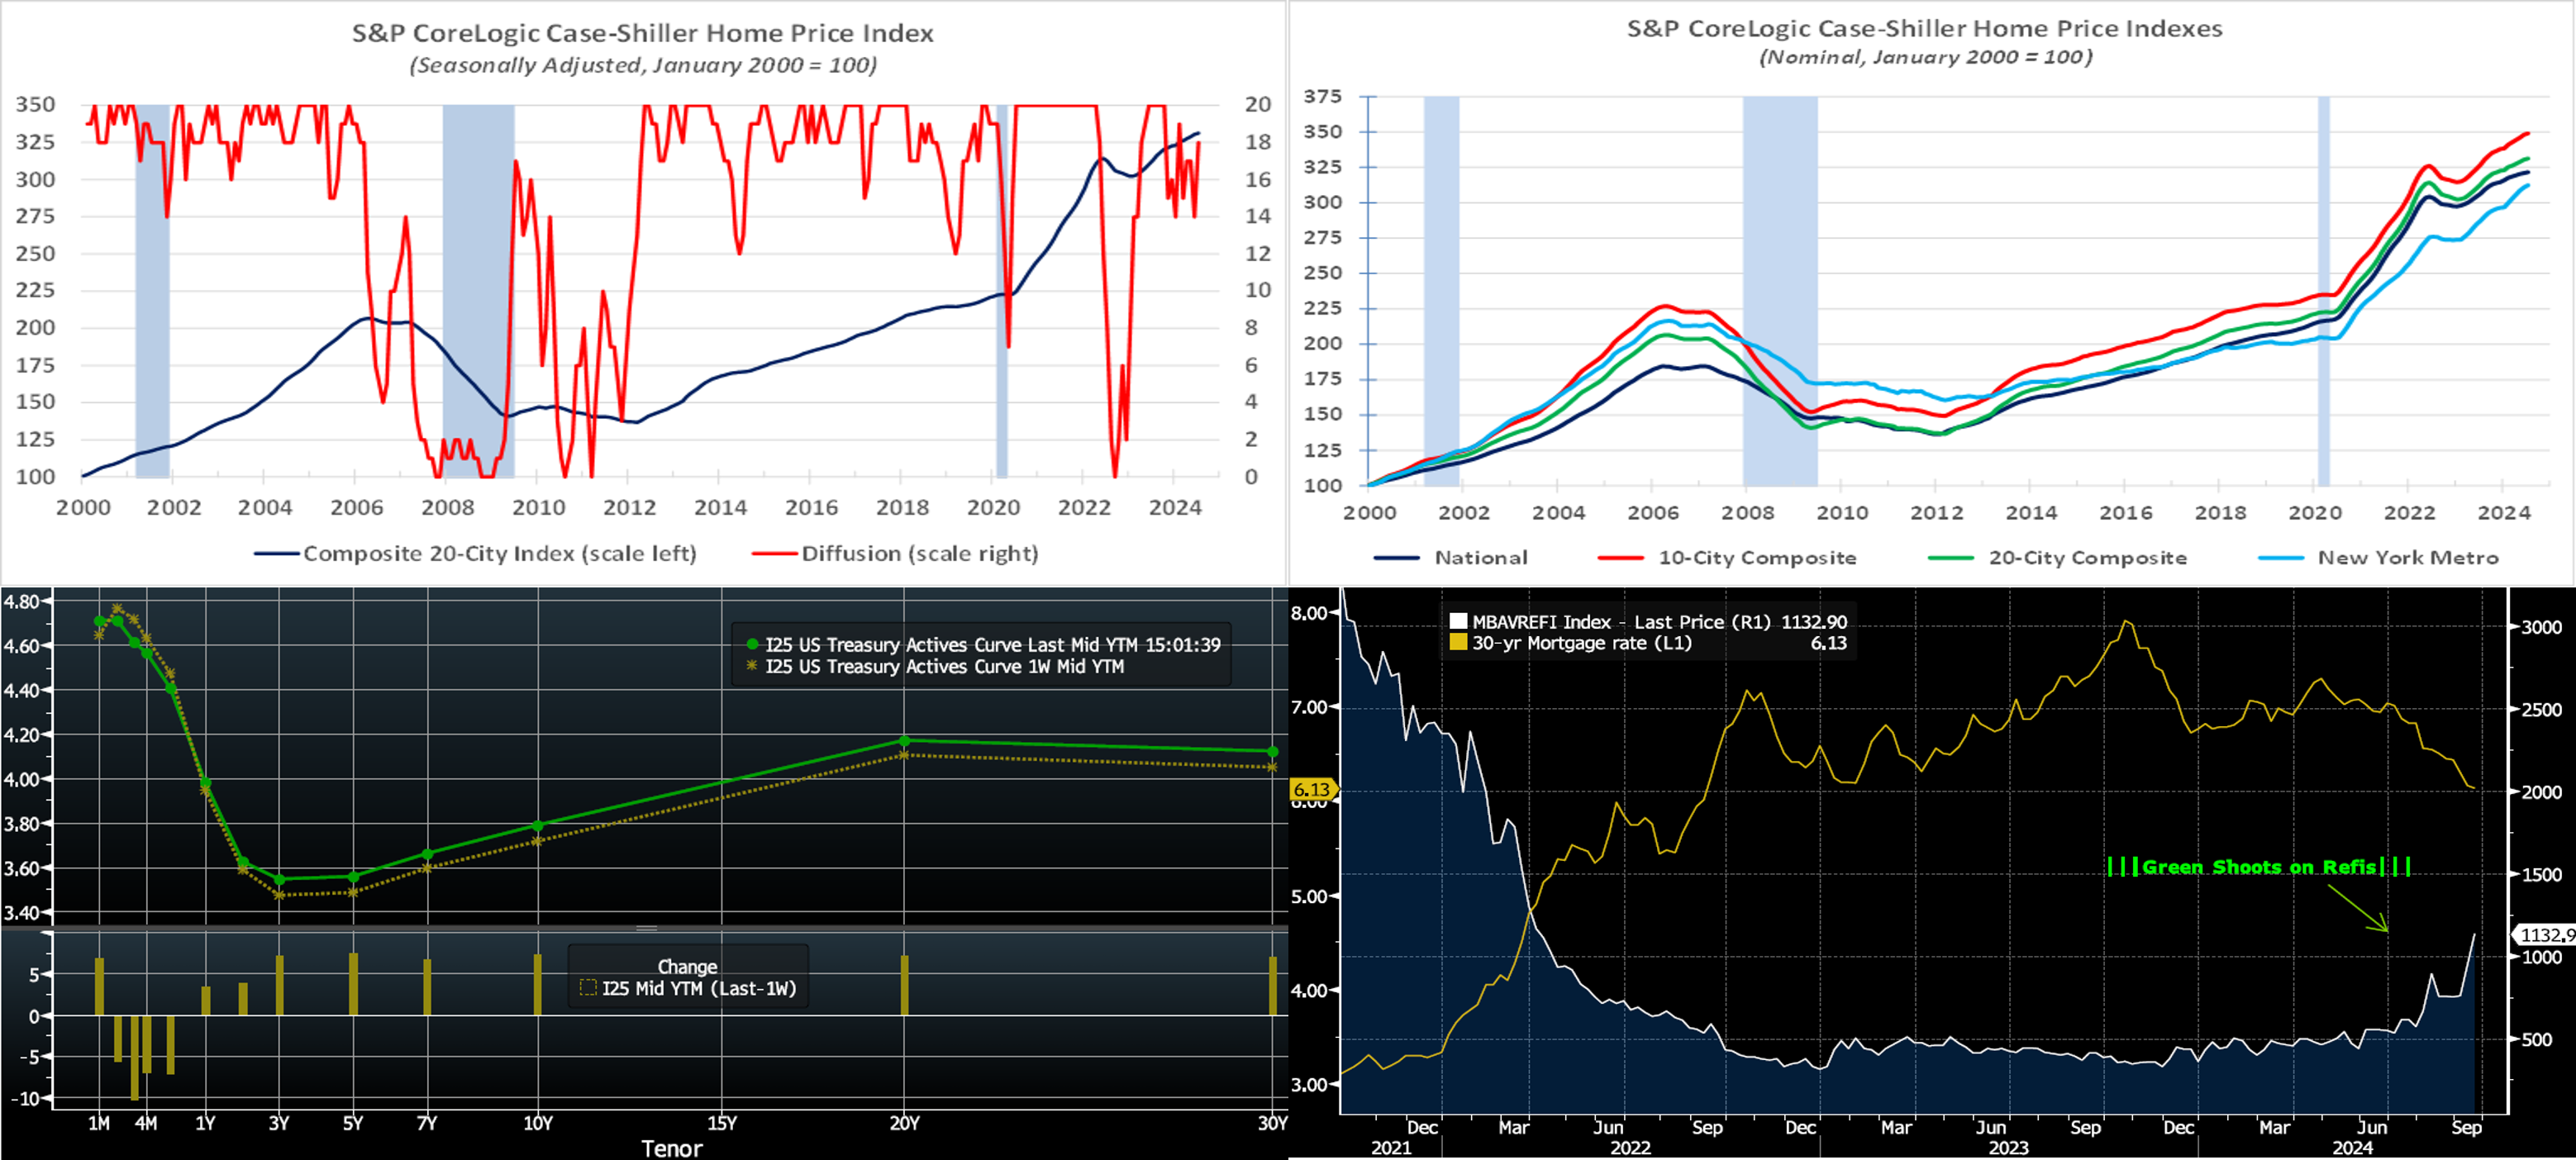
CHART 1 UPPER LEFT and CHART 2 UPPER RIGHT
Source: S&P CoreLogic Case-Shiller (SPCLCS); Bureau of Labor Statistics; National Bureau of Economic Research; FHLBNY. Released this past week, the SPCLCS 20-City Home Price Index climbed .27% higher in July, following an upwardly revised .47% (from .42%) increase in June. The reported increase placed home selling prices 5.9% above those witnessed 12 months earlier. The breadth of sequential seasonally adjusted price increases widened to a five-month high during the reference period, with 18 metro areas witnessing gains compared to 14 in June, per the diffusion measure. Seattle, New York, and Las Vegas experienced the largest price gains at the start of Q3; Denver, Dallas, and Atlanta the smallest. Prices declined in San Francisco and Tampa. Over the latest 12 months, New York, Las Vegas, and Los Angeles enjoyed the largest increases in prices; Portland, Denver, and Dallas the smallest. The price gains experienced in the NYC metro area since July 2023 eclipsed the 20-city average by a wide margin. In nominal terms, the SPCLCS national (5.7%), 20-city (5.4%), and 10-city gauges (7.0%) all registered well above their 2022 highs (per right-side chart). The sharp pickup in quotes across the NYC metro area since February of 2023 placed home selling prices a hefty 13.2% above those recorded two years earlier. The backdrop is less dramatic when inflation excluding shelter costs is taken into consideration, however. The national measure in real terms stands just 1.6% above the earlier high set in April 2022, while the 20-city barometer measured 1.3% above the level reached at that time. The performance of real home prices in the NYC metro area over the past two years has been especially impressive, with inflation-adjusted quotes now just 1.5% shy of the record peak reached in 2006.
CHART 3 LOWER LEFT
Source: Bloomberg. Top pane is yield (LHS, %), bottom pane is change (LHS, bps). As of Thursday afternoon, the UST term curve was modestly higher from the prior week. Adjusted for the new on-the-run securities, the 2-year was ~5.5 and the 5-year ~6 bps higher week-over-week. Economic data released this past week was relatively sturdy. Jobless claims were again under expectations, and the third estimate of Q2 GDP was a solid 2.9%. Further on GDP, the report contained important upward adjustments to real National Income & Product Account data. Average annualized growth in real GDP from Q1-2019 to Q2-2024 was revised higher from 2.2% to 2.5%. And average annualized growth in real gross domestic income (GDI) over this period, driven by large upward adjustments to the latest four quarters, was revised higher to a hefty 2.7%, up from the 1.7% previous estimate. In terms of market-implied pricing of the Fed, for end-2024 the market now prices for Fed Funds at 4.10%, two bps lower than last week and below the Fed’s latest “dot plot” projection of 4.375%. The market prices end-2025 ~2.91% which is well below the Fed’s projection of 3.375%; the market, in sum, “agrees” with the Fed’s long-run projection on Fed Funds ~2.875% but prices the Fed to act in much quicker fashion to get there.
CHART 4 LOWER RIGHT
Source: Bloomberg. After a prolonged period of trending sideways at meager levels, mortgage refinancings, with the assistance of lower rates, have perked higher in recent months. As seen here, the MBA REFI index (RHS) this week hit its highest level in almost 2.5 years, boosted by the recent and notable decline in mortgage rates (LHS, %) towards the lowest in two years. Hopefully, these “green shoots” will persist and thereby propel increases in housing turnover, supply, and affordability.
FHLBNY Advance Rates Observations
Front-End Rates
- Short-end rates were lower week-over-week by 2 to 15 bps, with the longer tenors leading and thereby flattening the short-end curve. Tenors are moving further into the timeline of projected further Fed rate cuts. Meanwhile, Money Market Fund AUM remains robust, thereby underpinning demand for short paper. Net T-bill issuance should continue its decline for another two weeks, owing to the mid-September corporate tax date, and likely help spreads on our paper.
- The market will monitor data, particularly the jobs report, and Fedspeak in the upcoming week.
Term Rates
- The longer-term curve, generally mirroring moves in USTs and swaps, was modestly higher from a week ago. The 2-year rose ~3 bps, while the rest of the curve was 4 to 5 bps higher. Kindly refer to the previous section for color on market dynamics and changes. We encourage members to engage with the desk for current rate levels and market dynamics.
- On the UST term supply front, the upcoming week serves a reprieve from auctions. Note that UST auctions usually occur at 1pm and can occasionally spur volatility around that time. Please contact the Member Service Desk for further information on market dynamics, rate levels, or products. Note that our “800 number” is again ready for use at 1-800-546-5101 option 1.
Small Business Recovery Grant (SBRG) Program: Starting July 29, 2024, the FHLB-NY will offer $5mn in grant funding under the 2024 SBRG Program. This program provides grant funds to benefit FHLB-NY members’ small businesses, including farms and non-profit customers. Via the program, members will be able to provide grants of up to $10,000 to qualifying small businesses that have faced challenges due to rates, inflation, supply-chain constraints, and/or rising energy costs. Funding will be limited to $50,000 per member.
The FHLBNY is pleased to announce the 2024 0% Development Advance (ZDA) Program, now available with a new streamlined submission process. This program provides members with subsidized funding in the form of interest rate credits to assist in originating loans or purchasing loans/investments that meet the eligibility criteria under the Business Development Advance (BDA), Climate Development Advance (CDA), Infrastructure Development Advance (IDA), or Tribal Development Advance (TDA). Please contact the Member Service Desk for information and/or visit our ZDA information page.
Price Incentives for Advances Executed Before Noon: In effect as of Tuesday, September 5, 2023, the FHLBNY is pleased to now offer price incentives for advances executed before Noon each business day. These pricing incentives offer an opportunity to provide economic value to our members, while improving cash and liquidity management for the FHLBNY. For further details, kindly refer to the Bulletin.
The Symmetrical Prepayment Advance Feature
For those anticipating term funding needs, and with rates on an uptrend, it can be an appropriate juncture to consider our SPA feature. This feature allows the member to capture, at prepayment, changes in the fair value of the advance which are favorable to the member. Contact Member Services Desk to discuss.
Looking for more information on the above topics? We’d love to speak with you!
Questions?
If you wish to receive the MSD Weekly Market Update in .pdf format (includes FHLBNY rate charts) or to discuss this content further, please email the MSD Team.