Member Services Desk
Weekly Market Update
This MSD Weekly Market Update reflects information for the week ending September 6, 2024.
Economist Views
Click to expand the below image.
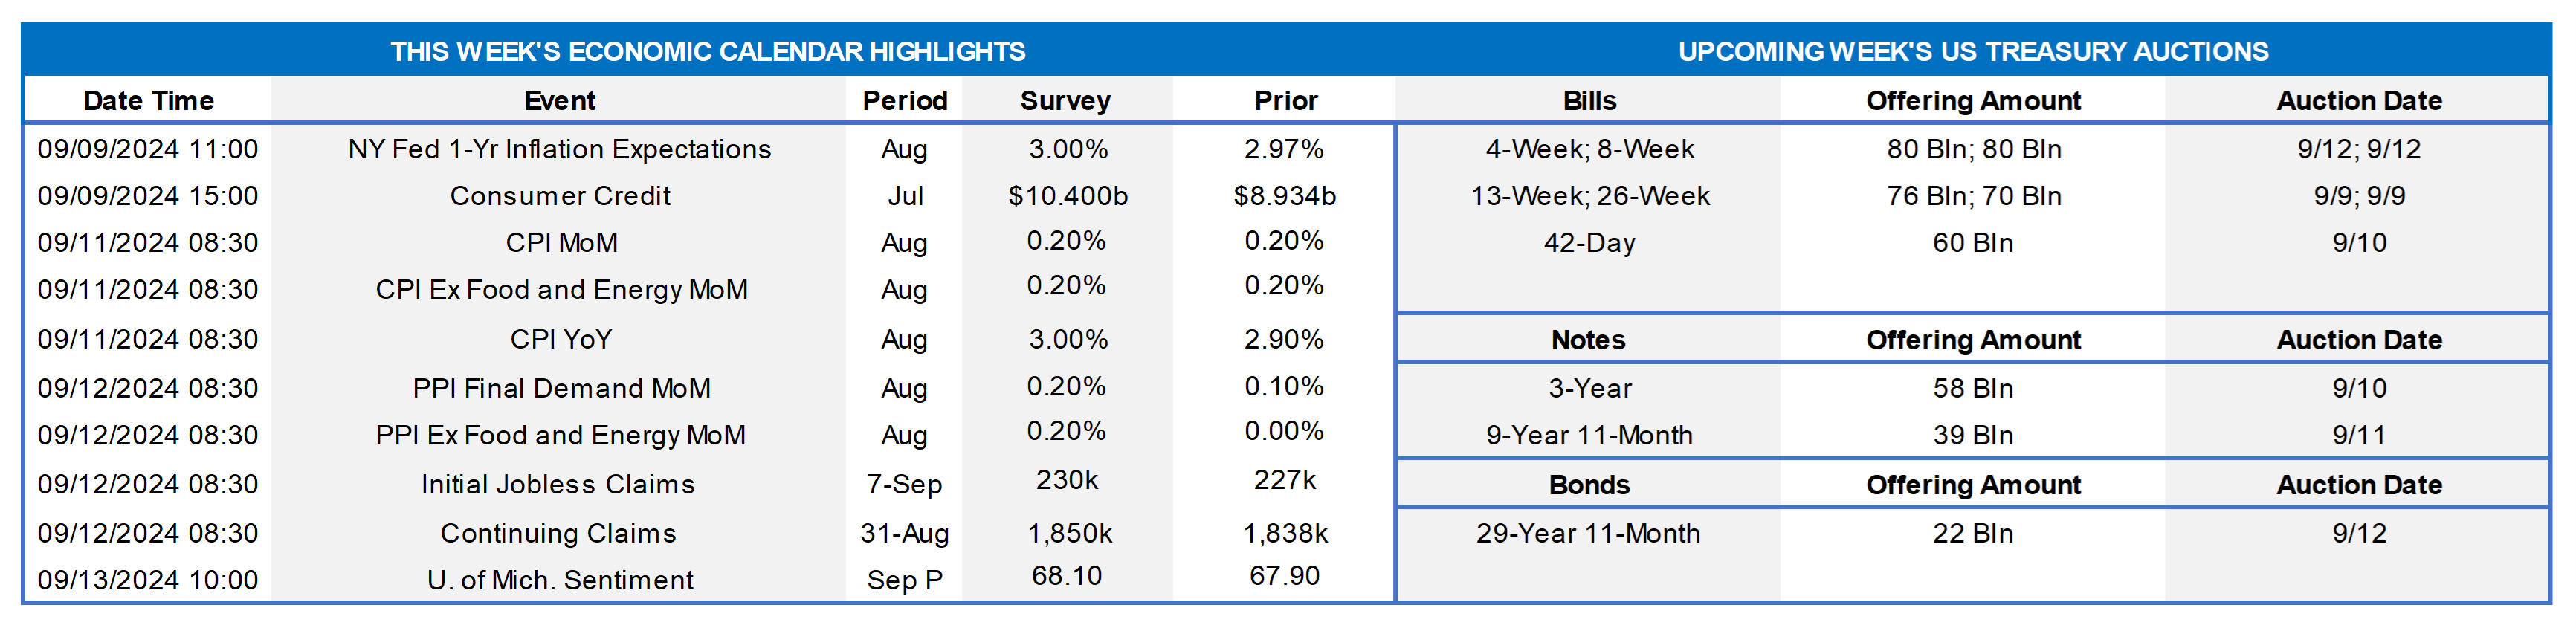
Following a week of employment-related data, the upcoming week will serve as a set of inflation data among a bevy of economic releases. Overall, and absent any major upside surprises, the data is expected to confirm the prevailing market sentiment that a 25-bps cut is a certainty at the September 18th FOMC, with a chance of an even-greater 50 bps cut. The Fed will be in blackout mode preceding the nearing FOMC, so economic data will be the primary focus of the market.
New York Fed Inflation Expectations: The survey for the 1-Yr Inflation Expectation is anticipated to be 3.0%, essentially the same as the prior reading of 2.97%.
Consumer Credit: The survey is expected to be $10.4bn, an increase from the previous $8.9bn reading.
Consumer Price Index (CPI) Report: CPI is expected to show a 0.20% increase, in line with the prior release. The less volatile CPI reading that excludes Food and Energy, known as core-CPI, is also expected to reflect a .20% increase and the same as last month. The Year-over-Year CPI reading is expected to be 3.00%, a .10% increase from the prior month.
Producer Price Index (PPI) Report: PPI is expected show an increase month-over-month of .20% for the headline number as well as the core (excluding food and energy). Given the day-prior release of CPI, this report may be of limited market impact.
Initial and Continuing Claims: The past week’s claims numbers were a tad better than expectations, more so on the Continuing Claims front which printed at 1838K vs. the expected 1867K number. The upcoming week is expected to be a touch higher but in a similar zone.
University of Michigan Sentiment Report: The Sentiment index is expected at 68.1, or slightly above the prior release of 67.9. The Current Conditions and inflation expectations components of the report will also be revealed, but this report is unlikely to sway markets much in front of the FOMC meeting in the subsequent week.
Federal Reserve Appearances: None, as the Fed will enter blackout mode preceding the September 17/18th FOMC gathering.

CHART 1 UPPER LEFT
Source: Bureau of Economic Analysis; JP Morgan. Shown here is the historical trend (LHS, %) of the Core Personal Consumption Expenditure (core-PCE) index, which is the Fed’s favored inflation gauge. It increased just 0.16% month-on-month in July. While the 2.6% year-ago rise is still a bit above the Fed’s 2% goal, the measure has risen at only a 1.7% annual rate over the last three months, thereby indicating a decelerating trend. With current Fed Funds Effective at 5.33% and inflation trending towards 2%, the “real” (nominal rate less inflation) Fed Funds rate is clearly in restrictive territory.
CHART 2 UPPER RIGHT
Source: Bureau of Labor Statistics (BLS). Shown here is the long-term trend of the number of unemployed persons per job opening (LHS), seasonally adjusted. The latest Job Openings and Labor Turnover Summary (JOLTS report) for July, released this past Wednesday, reflected decidedly less tight labor market conditions. Indeed, the number of job vacancies was reported at 7.67mn, which was below expectations of 8.1mn, and the prior month was revised slightly lower to 7.91mn from 8.18mn. The number of job openings per unemployed person is basically the inverse of the ratio charted here and now sits at just above 1.1. This ratio had been ~1.4 a year ago and ~2 in March 2022. Given the trends evident here and in the prior chart, as well as the Fed’s dual mandate on inflation and employment, the case for Fed easing has become clearer.
CHART 3 LOWER LEFT
Source: Bloomberg. Bloomberg. Top pane is yield (LHS, %), bottom pane is change (LHS, bps). As of Thursday afternoon, yields were lower across the UST term curve relative to the week prior. The 2-year was ~15 bps lower, and the 5-year ~13 bps lower. Considering the avalanche of corporate debt issuance to start the month, the move was impressive and mostly spurred by the above-mentioned data releases and the market’s more aggressive pricing of potential Fed cuts. The move lower, however, is vulnerable to a reversal if Friday’s (morning after this writing) jobs report reflects a still-steady employment situation. In terms of market-implied pricing of the Fed, the market prices a 132% chance, up from 124% last week, of a 25 bps cut in September; in other words, that is a ~32% chance of a 50 bps cut. For end-2024, the market now prices for Fed Funds at 4.26%, or ~8 bps lower than last week, which equates to a bit over four 25-bps cuts. Relative to last week, the market also priced cuts in the 2025-and-out zone a tad more aggressively, and this dynamic further served to prompt the move lower in term yields.
CHART 4 LOWER RIGHT
Source: Bloomberg. Here is further evidence that a Fed easing cycle may be shortly at hand. Charted here is the 5-year TIPS (Treasury Inflation Protected Security) Breakeven inflation rate (White, RHS, %, calculated as the yield of the 5-year UST less the yield of a 5-year TIPS). Also shown is the Fed Funds Upper Bound rate (Gold, RHS, %). The Fed’s stated goal for inflation is 2%, per the green horizontal line seen here. Notably, the 5-year Breakeven rate is now sub-2% and trading ~1.91% as of this writing. Having begun in mid-March 2022, the current “hike-then-hold” cycle is now in its 30th month. The Fed has endured some criticism for waiting too long to hike rates back in 2022. Naturally, hindsight is “20-20”, but the Fed is likely now sensitive to the potential impacts of waiting too long to cut rates. Given that the “real” (less inflation) Fed Funds rate, whether using the latest inflation data prints or market projections from TIPS, is well above what is generally considered neutral territory, a shift to a less restrictive policy appears imminent.
FHLBNY Advance Rates Observations
Front-End Rates
- Short-end rates were mixed but mostly lower, relative to a week ago. The shortest tenors 2-week-and-in were a few bps higher. Meanwhile, longer tenors are moving further into the timeline of expected Fed cuts and so have, in turn, declined by 2- to 8 bps. Moreover, Money Market Fund AUM remains robust, thereby underpinning demand for short paper. Net T-bill issuance should decline in the weeks ahead and possibly help spreads on our paper.
- The market’s focus will remain on economic data, particularly given the Fed’s blackout period preceding this month’s FOMC meeting.
Term Rates
- The longer-term curve, generally mirroring moves in USTs and swaps, was lower by 14 to 16 bps from a week ago. Kindly refer to the previous section for color on market dynamics and changes. Shorter-tenor putable advances remain of interest on dips in market rates. We encourage members to engage with the Member Service Desk for current rate levels and market dynamics.
- On the UST term supply front, the upcoming week serves a slate of 3/10/30-year auctions. Note that UST auctions usually occur at 1pm and can occasionally spur volatility around that time. Please contact the Member Service Desk for further information on market dynamics, rate levels, or products. Note that our “800 number” is again ready for use at 1-800-546-5101 option 1.
Small Business Recovery Grant (SBRG) Program: Starting July 29, 2024, the FHLB-NY will offer $5mn in grant funding under the 2024 SBRG Program. This program provides grant funds to benefit FHLB-NY members’ small businesses, including farms and non-profit customers. Via the program, members will be able to provide grants of up to $10,000 to qualifying small businesses that have faced challenges due to rates, inflation, supply-chain constraints, and/or rising energy costs. Funding will be limited to $50,000 per member.
The FHLBNY is pleased to announce the 2024 0% Development Advance (ZDA) Program, now available with a new streamlined submission process. This program provides members with subsidized funding in the form of interest rate credits to assist in originating loans or purchasing loans/investments that meet the eligibility criteria under the Business Development Advance (BDA), Climate Development Advance (CDA), Infrastructure Development Advance (IDA), or Tribal Development Advance (TDA). Please contact the Member Service Desk for information and/or visit our ZDA information page.
Price Incentives for Advances Executed Before Noon: In effect as of Tuesday, September 5, 2023, the FHLBNY is pleased to now offer price incentives for advances executed before Noon each business day. These pricing incentives offer an opportunity to provide economic value to our members, while improving cash and liquidity management for the FHLBNY. For further details, kindly refer to the Bulletin.
The Symmetrical Prepayment Advance Feature
For those anticipating term funding needs, and with rates on an uptrend, it can be an appropriate juncture to consider our SPA feature. This feature allows the member to capture, at prepayment, changes in the fair value of the advance which are favorable to the member. Contact Member Services Desk to discuss.
Looking for more information on the above topics? We’d love to speak with you!
Questions?
If you wish to receive the MSD Weekly Market Update in .pdf format (includes FHLBNY rate charts) or to discuss this content further, please email the MSD Team.