Member Services Desk
Weekly Market Update
This MSD Weekly Market Update reflects information for the week ending August 30, 2024.
Economist Views
Click to expand the below image.
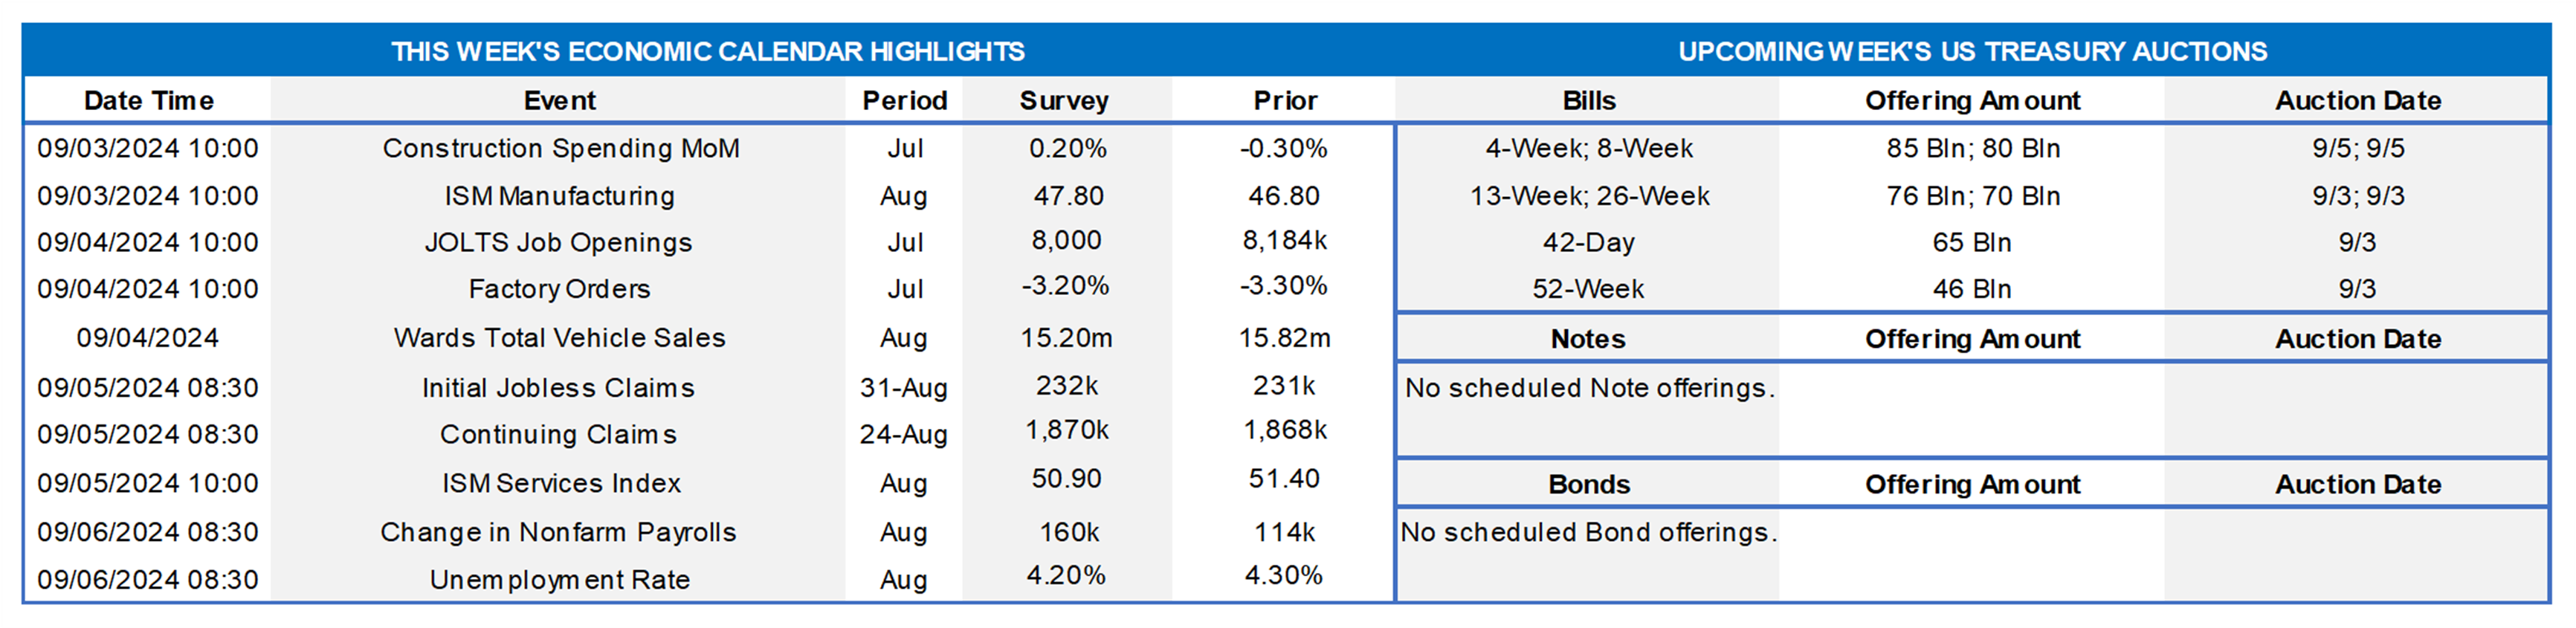
Returning from the extended Labor Day weekend, market participants will contend with a crowded economic release calendar. With monetary policymakers now squarely focused on the employment side of the Federal Reserve’s dual mandate, the Bureau of Labor Statistics’ (BLS) update on labor market conditions will undoubtedly be the marquee report of the week and very well could determine the size of any cut in administered rates in mid-September.
Construction Spending: Hampered by poor weather conditions, in particular Hurricane Beryl, the nominal value of new construction put-in-place likely contracted for a third consecutive month in July.
ISM Manufacturing Activity Index: Available manufacturing canvasses suggest that the closely followed gauge contracted for a fifth straight month in August, dipping to 46.4% from 46.8% in July.
JOLTS Job Openings: A reported uptick in online help-wanted postings suggests that nationwide job openings rose by 46K to 8.23mn in July, completely reversing June’s reported decline. At an estimated 1.07mn, the excess of vacant positions nationwide would represent 1.15 jobs per unemployed person.
Factory Orders: Powered by a commercial aircraft-led leap in durable goods bookings, factory orders probably climbed by 4.8% last month, completely reversing the 3.3% decline witnessed in June.
Motor Vehicle Sales: Sales of light trucks and passenger cars likely remained on a saw-toothed path in August, retreating to a seven-month low seasonally adjusted annual rate of 15.2mn.
ISM Services Activity Index: The expansion in service-producing activity probably continued in August, with the barometer expected to climb to a three-month high of 52.2%.
Employment Situation Report: The Street currently anticipates a 155K rise in nonfarm payrolls after a tepid 114K prior-month gain, but swings in weather conditions between the July and August canvassing periods instills uncertainty to that forecast. Undoubtedly due to the impact of Hurricane Beryl, the number of persons who could not work because of bad weather leaped to 436K in July from 59K in June – a record high for that calendar month and well above the historical average of just 32K witnessed over the prior three decades. Milder temperatures and considerably less precipitation during the August establishment period could propel job growth back above the 250K mark. The consensus call for a downtick in the civilian unemployment rate to 4.2% appears reasonable, although a slightly larger decline cannot be ruled out. Due to the above, the average private workweek likely will rebound by six minutes to 34.4 hours. With a five-week interval between the July and August canvasses, average hourly earnings growth could exceed the 0.3% increase projected by the Street.
Federal Reserve Appearances:
- Sept. 4 Federal Reserve to release Beige Book summary of district economic conditions.
- Sept. 6 New York Fed President Williams to give keynote remarks at an event hosted by the Council on Foreign Relations.
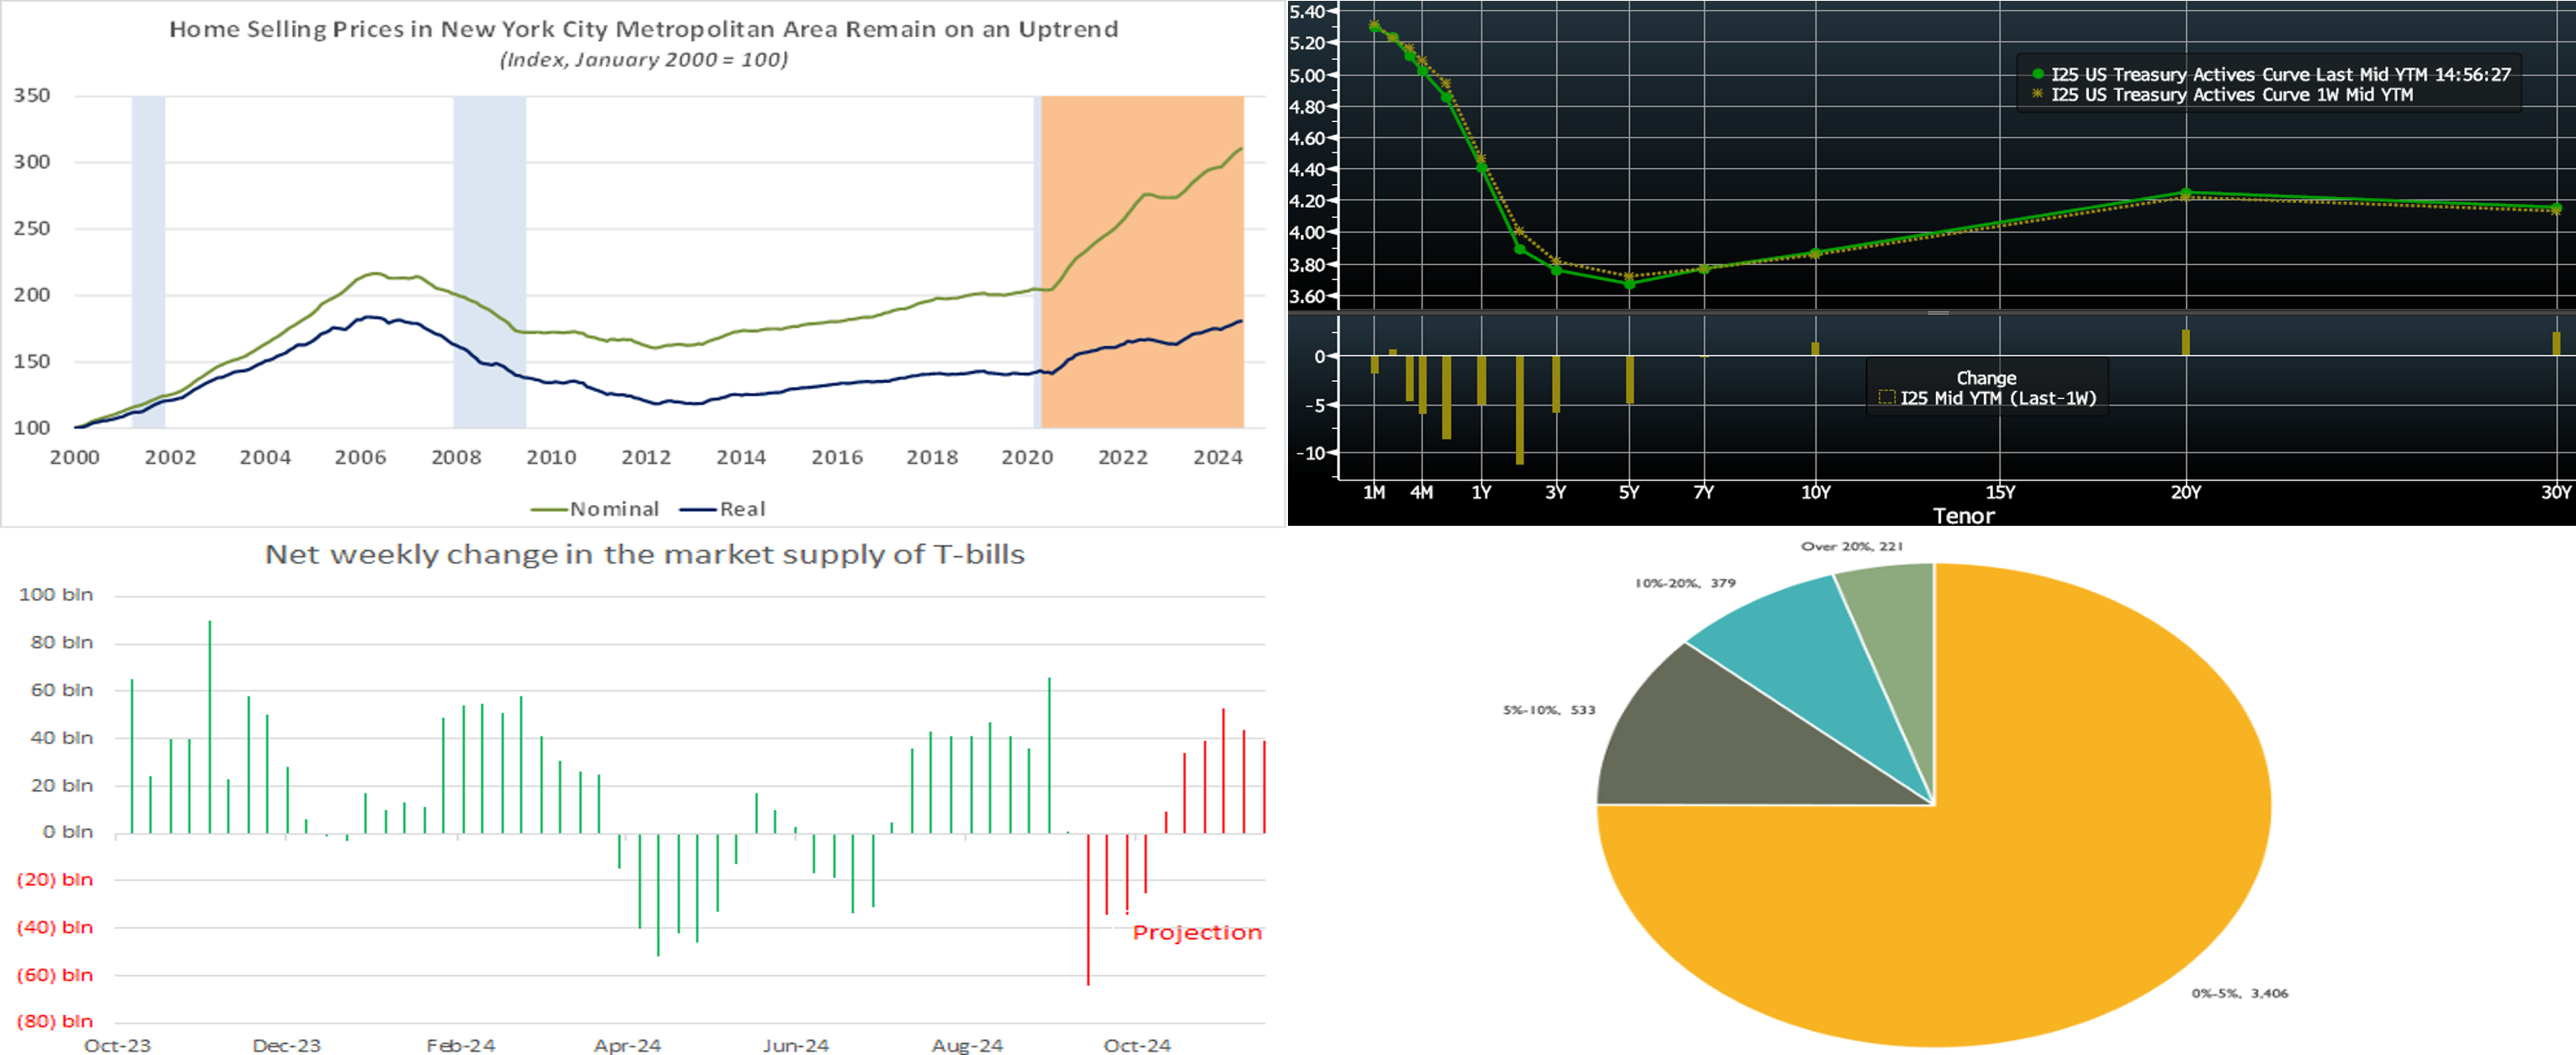
CHART 1 UPPER LEFT
Source: Bureau of Labor Statistics; National Bureau of Economic Research; S&P CoreLogic Case-Shiller; FHLB-NY. Notes: Blue-shaded areas denote recessions; orange-shaded area highlights the current economic expansion. Home selling prices remained on an uptrend across the NYC metro area as the spring quarter ended. S&P CoreLogic Case-Shiller (SPCLCS) reported that local home prices rose by 0.6% to a record 310.7 (January 2000 = 100) in June, boosting the cumulative increase since the end of 2022 to 13.5%. At 8.9%, the rise in local home prices over the last 12 months was the largest across the 20 major metropolitan areas canvassed by SPCLCS. After adjusting for consumer prices, excluding shelter costs, the picture, while still positive, is less steamy. Real home prices in the NYC area climbed by 0.4% in June and have gained 10.5% since December 2022. Of note, real home prices in June stood just 1.7% below the peak posted before the Great Recession in March 2006.
CHART 2 UPPER RIGHT
Source: Bloomberg. Bloomberg. Top pane is yield (LHS, %), bottom pane is change (LHS, bps). As of Thursday afternoon, the UST term curve was steeper from a week ago, with shorter tenors dipping but longer ones unchanged to a tad higher. Both adjusted for the roll to new on-the-run securities, the 2-year was ~8 bps lower and the 5-year ~3 bps lower. The 10-year rose roughly a bp. The week held a dearth of first-tier data. Fed Chair Powell, last Friday at the Jackson Hole gathering, did clearly indicate that rate cuts are in the offing and that the Fed no longer welcomes further cooling in the labor market. In this light, the upcoming week’s jobs report will be a highlight. In terms of market-implied pricing of the Fed, the market prices a 124% chance, down from 116% last week, of a 25 bps cut in September; in other words, that is a 24% chance of a 50 bps cut. For end-2024, the market now prices for fed funds at 4.34%, or ~4 bps lower than last week, which equates to just a smidge shy of four 25-bps cuts. Relative to last week, the market priced cuts in the 2025-and-out zone a tad more aggressively, and this dynamic helped the move lower in term yields.
CHART 3 LOWER LEFT
Source: Treasury Direct; US Treasury; Primary Dealer Survey. Shown here is the recent trend, as well as projections, of weekly net T-bill issuance (LHS, $bn). After the past few months in positive territory, net supply is expected to turn negative in the month ahead as the September corporate tax date nears. This dynamic, all else equal and in concert with ongoing high AUM levels in money market funds, should be marginally supportive of short-end paper valuations, including FHLB’s. The lower supply may also ease upward pressures, via less settlements to finance, on overnight repo rates. Meanwhile, next week’s economic data could be key for the market’s pricing of the Fed. If the data is solid and the market pares back the extent/pace of Fed cuts in the next year, then short-end investors may become more willing to extend in maturity and thereby provide support to spreads on short-end paper.
CHART 4 LOWER RIGHT
Source: The Bank Treasury Newsletter; Call Reports; Fis FedFis LLC. In response to banking woes in early 2023, the FDIC recently proposed stricter restrictions on the availability of brokered deposits to banks under stress. Section 29 of the Federal Deposit Insurance Act declares that banks that do not meet the well-capitalized threshold defined under Prompt Corrective Action will face restrictions on access to brokered deposits. Fortunately, out of the ~4500 currently chartered commercial banks, only a few dozen might now fall in this category. Meanwhile, as seen here, the number of banks using the brokered market to a high degree is a small fraction of the overall industry. Charted here are brokered deposits as a percentage of total deposits and then also the number of banks in each percentage stratum. As shown, ~75% of the banking system uses brokered deposits for 5% or less of its total deposits, whereas only ~5% of the system uses brokered for over 20% of total deposits.
FHLBNY Advance Rates Observations
Front-End Rates
- Short-end rates were mixed, relative to a week ago. The shortest tenors 3-week-and-in were up by 3 to 5 bps, but 1-month-and-longer were lower by 3 to 6 bps. As evidenced in SOFR rising by 4 bps over the past week, month-end and UST settlement dynamics instilled upward pressure on the shortest tenor rates. Meanwhile, longer tenors are moving further into the timeline of expected Fed cuts and so can naturally decline thereby. Moreover, Money Market Fund AUM remains robust, thereby underpinning demand for short paper. Net T-bill issuance should decline in the weeks ahead; please see our note on the prior slide for more information.
- The market’s focus will remain on economic data, particularly the top-tier jobs report to be released on Friday.
Term Rates
- The longer-term curve, generally mirroring moves in USTs and swaps, was steeper from a week ago. The 2-year was ~8 bps lower, the 5-year ~ 5bps lower, and the 10-year a bp higher. Kindly refer to the previous section for color on market dynamics and changes. Shorter-tenor putable advances remain of interest on dips in market rates. We encourage members to engage with the Member Service Desk for current rate levels and market dynamics.
- On the UST term supply front, the upcoming week serves as a respite from auctions. Note that UST auctions usually occur at 1pm and can occasionally spur volatility around that time. Please contact the Member Service Desk for further information on market dynamics, rate levels, or products. Note that our “800 number” is again ready for use at 1-800-546-5101 option 1.
Small Business Recovery Grant (SBRG) Program: Starting July 29, 2024, the FHLB-NY will offer $5mn in grant funding under the 2024 SBRG Program. This program provides grant funds to benefit FHLB-NY members’ small businesses, including farms and non-profit customers. Via the program, members will be able to provide grants of up to $10,000 to qualifying small businesses that have faced challenges due to rates, inflation, supply-chain constraints, and/or rising energy costs. Funding will be limited to $50,000 per member.
The FHLBNY is pleased to announce the 2024 0% Development Advance (ZDA) Program, now available with a new streamlined submission process. This program provides members with subsidized funding in the form of interest rate credits to assist in originating loans or purchasing loans/investments that meet the eligibility criteria under the Business Development Advance (BDA), Climate Development Advance (CDA), Infrastructure Development Advance (IDA), or Tribal Development Advance (TDA). Please contact the Member Service Desk for information and/or visit our ZDA information page.
Price Incentives for Advances Executed Before Noon: In effect as of Tuesday, September 5, 2023, the FHLBNY is pleased to now offer price incentives for advances executed before Noon each business day. These pricing incentives offer an opportunity to provide economic value to our members, while improving cash and liquidity management for the FHLBNY. For further details, kindly refer to the Bulletin.
The Symmetrical Prepayment Advance Feature
For those anticipating term funding needs, and with rates on an uptrend, it can be an appropriate juncture to consider our SPA feature. This feature allows the member to capture, at prepayment, changes in the fair value of the advance which are favorable to the member. Contact Member Services Desk to discuss.
Looking for more information on the above topics? We’d love to speak with you!
Questions?
If you wish to receive the MSD Weekly Market Update in .pdf format (includes FHLBNY rate charts) or to discuss this content further, please email the MSD Team.