Member Services Desk
Weekly Market Update
This MSD Weekly Market Update reflects information for the week ending August 23, 2024.
Economist Views
Click to expand the below image.
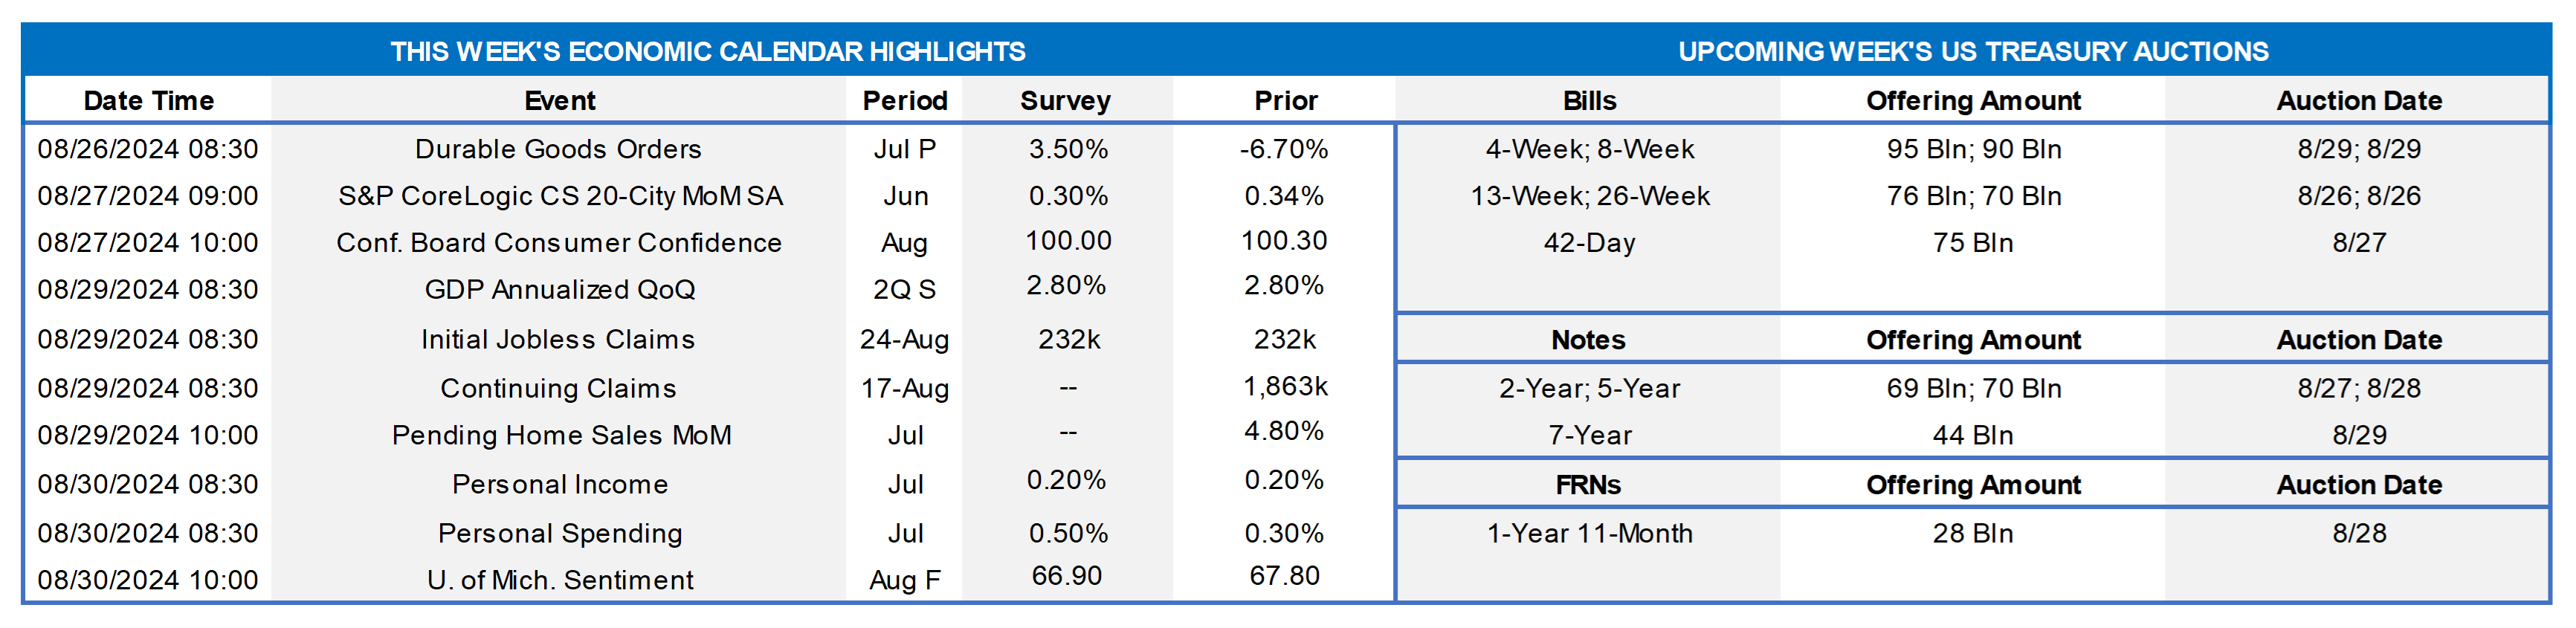
Markets will face a busy economic calendar in the week ahead. On balance, the forthcoming data is expected to be positive. Durable goods orders probably soared in July, while pending home sales climbed higher for a second straight month. Consumer sentiment gauges likely improved upon their prior-period readings. The second look at Q2 real GDP growth is expected to reveal that the economy expanded at an above-trend pace. Consumer spending figures for July probably will reveal that Q3 began on a high note. Initial claims will provide a first glimpse at labor market conditions beyond the canvassing period for the August employment report. As of this writing, Atlanta Fed President Raphael Bostic – a FOMC voting member – is the only Fed official slated to appear in public.
Durable Goods Orders: Powered by a commercial aircraft-led leap in transportation equipment bookings, durable goods orders probably jumped by 9.5% in July, erasing the 6.7% falloff suffered in the previous month. Net of the anticipated strength in transportation requisitions, durable goods orders likely were little changed after the .4% rise witnessed in June.
S&P CoreLogic Case-Shiller (SPCLCS) 20-City Home Price Index: Home price increases probably slowed marginally across the twenty major metropolitan areas canvassed by SPCLCS in June, rising by .23% after a .34% uptick in May. That projection, if realized, would place the SPCLCS barometer 6% above the level posted 12 months earlier.
Conference Board Consumer Confidence: Preliminary soundings from the University of Michigan suggest that the consumer sentiment gauge climbed to a five-month high of 103 in August from 100.3 in the previous month. Pay attention to the labor differential – the percentage of respondents believing that jobs are plentiful less than those feeling positions are hard to get – for clues to the likely change in the civilian unemployment rate this month.
Jobless Claims: Initial claims for unemployment insurance benefits probably remained in a 225K to 235K range during the filing period ended August 24. Keep a close eye on continuing claims during the preceding week for signs that recently furloughed employees are having a more challenging time finding work.
Merchandise Trade Balance: The merchandise trade deficit is expected to have widened to $97.3bn in July from $96.6 billion in the prior month.
Real GDP Growth: The Bureau of Economic Analysis’ second pass at real GDP growth during Q2 is expected to be little changed from the 2.8% annualized clip posted in the advance report.
Pending Home Sales: Buoyed by recent reductions in mortgage interest rates, home-purchase contract signings probably rose in July, building on the surprisingly large 4.8% increase recorded in June.
Personal Income & Consumer Spending: Capped by an anticipated dip in wage and salary disbursements during the reference period, personal income probably was unchanged in July, following a 0.3% gain in the previous month. Available evidence suggests that nominal consumer spending quickened during the reference period, climbing by .6% after a .3% gain in June.
Michigan Consumer Sentiment Index: Consumers’ appraisals of current and prospective economic conditions probably improved further over the latter half of August, lifting the University of Michigan’s confidence gauge to a three-month high of 68.4.
Federal Reserve Appearances:
- Aug. 28 Atlanta Fed President Bostic to speak about the outlook with the Stanford Club of Georgia.
- Aug. 29 Atlanta Fed President Bostic to speak about the outlook at Georgia Tech’s Scheller College of Business.
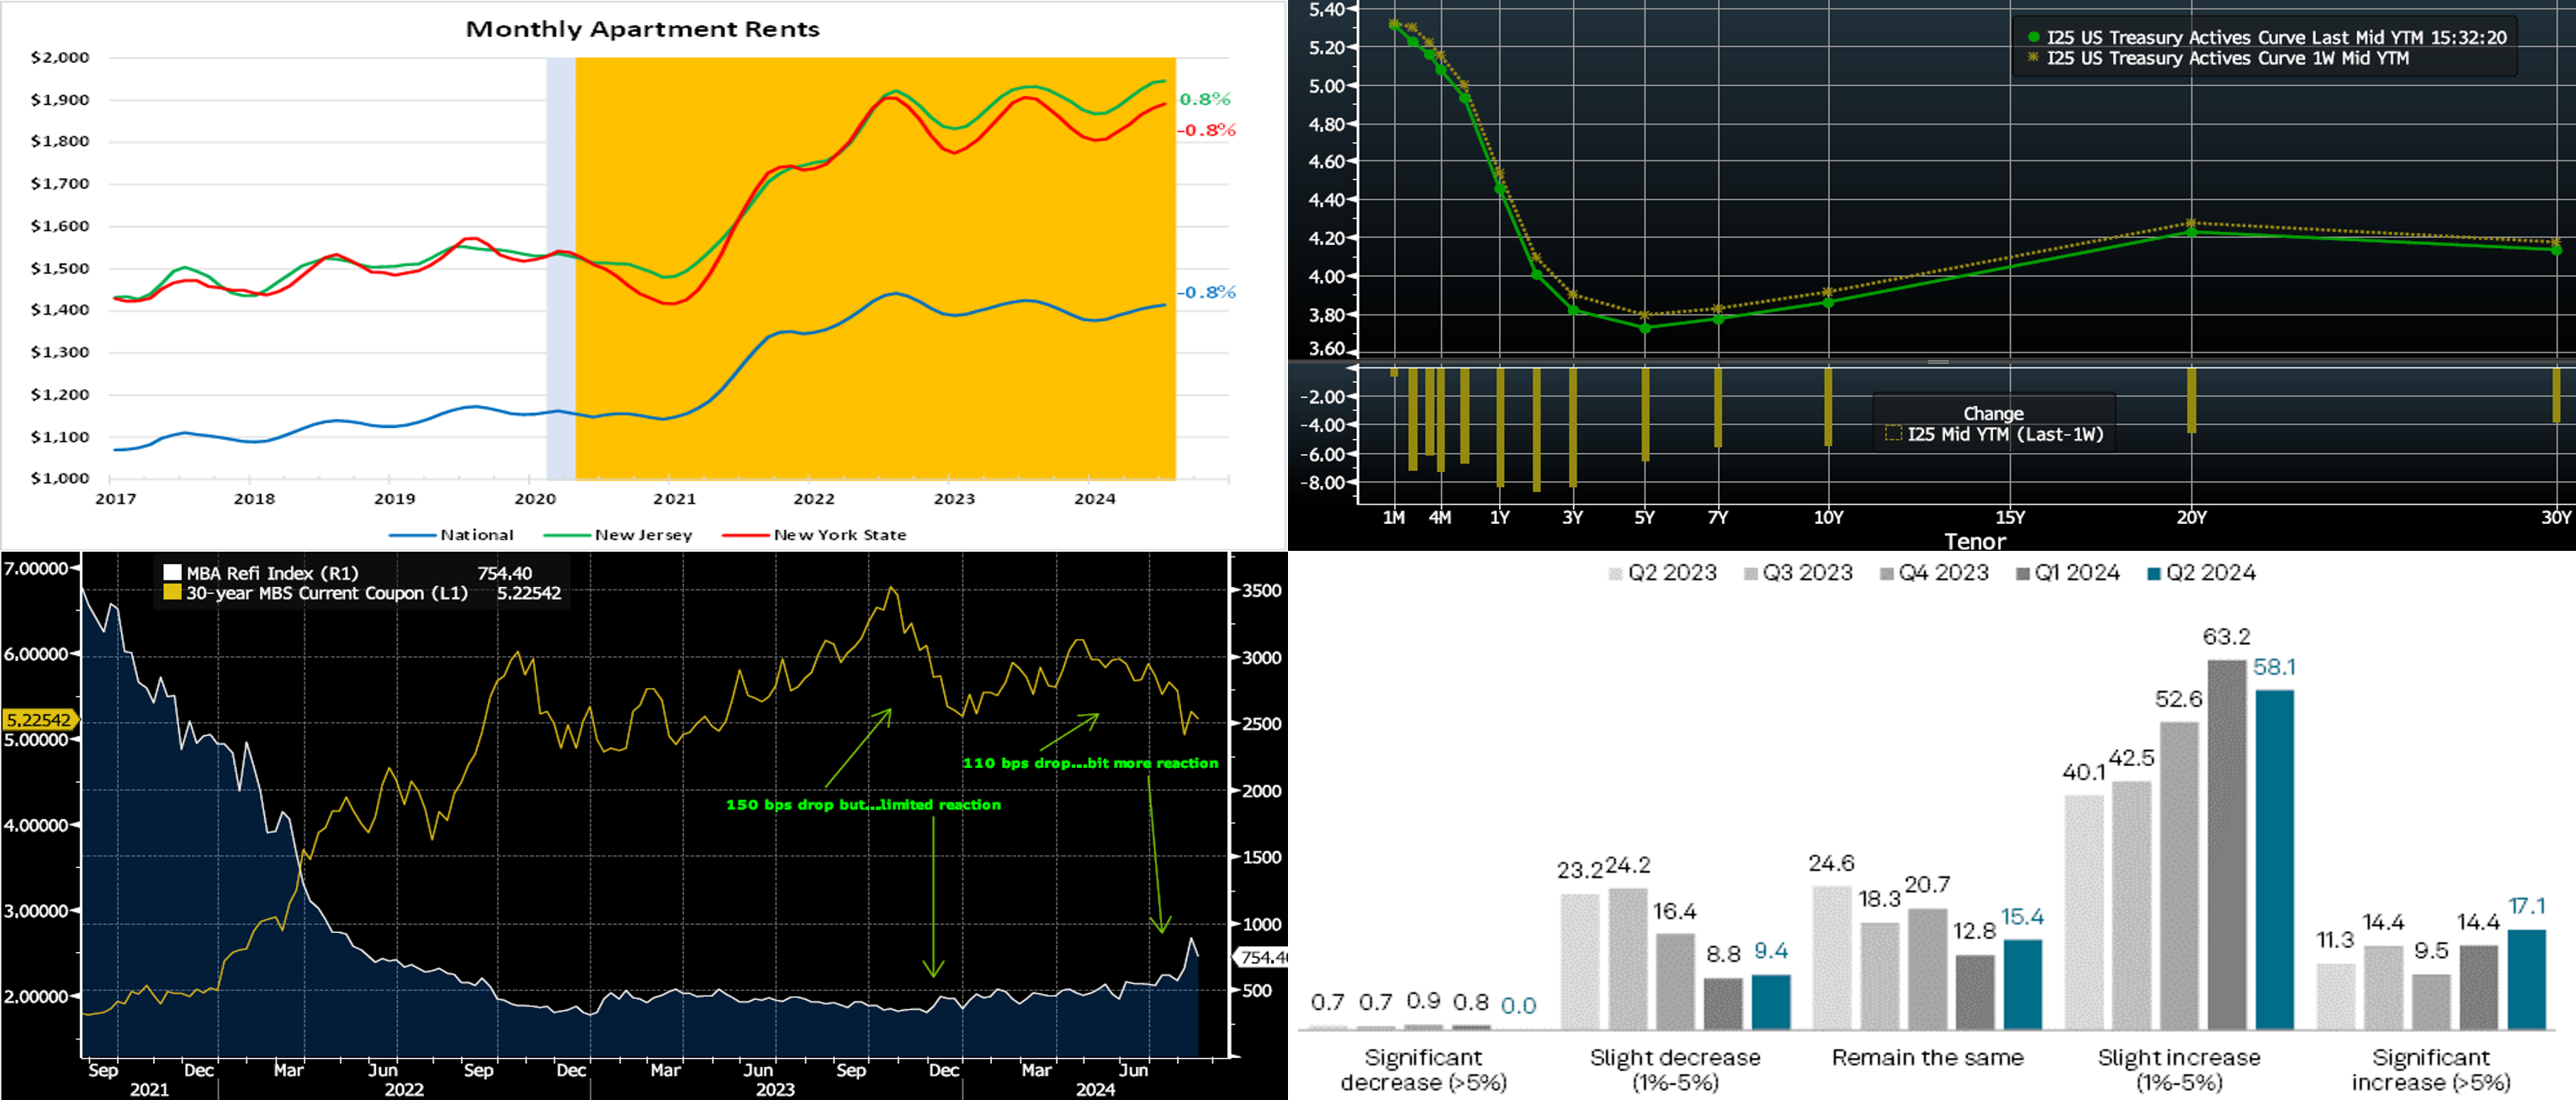
CHART 1 UPPER LEFT
Source: Apartment List; National Bureau of Economic Research. Notes: Blue-shaded area denotes recession; orange-shaded highlights current economic expansion; percentage changes shown are from July 2023. Monthly apartment rental growth rates have slowed markedly across the country and within the FHLB-NY district. Although apartment rental rates in both New York State and New Jersey have been moving higher in absolute terms since the beginning of the year, the upward drift appears attributable to normal seasonal patterns. Indeed, apartment rental rates across the Empire and Garden States stand 0.8% below and 0.8% above their respective July 2023 levels – both well off the double-digit growth rates witnessed at the beginning of 2022.
CHART 2 UPPER RIGHT
Source: Bloomberg. Bloomberg. Top pane is yield (LHS, %), bottom pane is change (LHS, bps). As of Thursday afternoon, the UST term curve bull-steepened, with all tenors declining and longer ones leading the way. The 2-year was ~9 bps lower, the 5-year ~7 bps lower, and the 10-year ~ 6 bps lower. Data during the week was light, but a few mildly dovish comments from Fed members helped influence yields a bit lower. In terms of market-implied pricing of the Fed, the market prices a 116% chance, down from 127% last week, of a 25 bps cut in September; in other words, that is a 16% chance of a 50 bps cut. For end-2024, the market now prices for fed funds at 4.38%, or ~3 bps lower than last week, which equates to ~3.8 25-bps cuts. Relative to last week, the market priced cuts in the 2025-and-out zone a bit more aggressively, and this dynamic helped the move lower in term yields.
CHART 3 LOWER LEFT
Source: Bloomberg. Shown here is the Mortgage Bankers Association Refinancing Index (White, RHS) vs. the 30-year MBS Current Coupon (Gold, LHS, %). Naturally, one would expect declines in the latter to spur subsequent declines in the former, and this relationship is clear here. The Refi index has trended sideways for much of the past two years, as mortgage rates rose from historically low levels and thereby put an overwhelming majority of the mortgage universe “out of the money” for refinancing. This summer’s downtrend in rates, however, has prompted the Refi index to at least “get off the mat.” At this stage of the cycle, there are certainly more mortgages struck in the past two years that are now nearing or through the incentive zone, usually at least 50bps lower than a current homeowner’s mortgage rate. Note that the recent bump higher (from ~450 to ~900) in the Refi index is of much greater magnitude than that of late 2023 (from ~328 to ~446), and the recent bump higher resulted from a smaller decline in rates. In this light, optimism is warranted for this space, assuming rates decline further or remain in their current zone.
CHART 4 LOWER RIGHT
Source: S&P Global Intelligence. A recent (this past June) S&P survey of the US banking industry revealed a generally positive tone on the lending front. Indeed, 75.2% of respondents expected total loans to grow at their institution over the next year. While this result was a tad lower than the 77.6% from the Q1 survey, it was well above the 51.4% result from the year-ago survey. Moreover, those expecting total loans to grow 5% or more increased to 17.1% which is the highest in multiple quarters. In actual aggregate loan growth for Q2, financial firms (banks, thrifts, credit unions) posted 1% quarterly loan growth, which was the highest level since Q4 2022.
FHLBNY Advance Rates Observations
Front-End Rates
- Short-end rates, relative to a week ago, were notably lower and led by the longer tenors. The 1-month was 6 bps lower, while 6-month was 11 bps lower. Money Market Fund AUM remains robust and has reached fresh record levels, thereby helping demand for short paper. Net T-bill issuance has increased in recent weeks, but the supply/demand dynamic remains relatively sturdy, with FHLB paper tightening from levels of past weeks. Meanwhile, the market’s pricing of slightly more aggressive Fed cuts also helped to drive the longer tenors lower.
- The market’s focus will remain on economic data and the limited number of Fed speakers.
Term Rates
- The longer-term curve, generally mirroring moves in USTs and swaps, was lower and steeper. The 2-year dropped ~11 bps and the 5-year ~8 bps. Kindly refer to the previous section for color on market dynamics and changes. Shorter-tenor putable advances remain of interest on dips in market rates. We encourage members to engage with the Member Service Desk for current rate levels and market dynamics.
- On the UST term supply front, the upcoming week serves a slate of 2/5/7-year auctions. Note that UST auctions usually occur at 1pm and can occasionally spur volatility around that time. Please contact the Member Service Desk for further information on market dynamics, rate levels, or products. Note that our “800 number” is again ready for use at 1-800-546-5101 option 1.
Small Business Recovery Grant (SBRG) Program: Starting July 29, 2024, the FHLB-NY will offer $5mn in grant funding under the 2024 SBRG Program. This program provides grant funds to benefit FHLB-NY members’ small businesses, including farms and non-profit customers. Via the program, members will be able to provide grants of up to $10,000 to qualifying small businesses that have faced challenges due to rates, inflation, supply-chain constraints, and/or rising energy costs. Funding will be limited to $50,000 per member.
The FHLBNY is pleased to announce the 2024 0% Development Advance (ZDA) Program, now available with a new streamlined submission process. This program provides members with subsidized funding in the form of interest rate credits to assist in originating loans or purchasing loans/investments that meet the eligibility criteria under the Business Development Advance (BDA), Climate Development Advance (CDA), Infrastructure Development Advance (IDA), or Tribal Development Advance (TDA). Please contact the Member Service Desk for information and/or visit our ZDA information page.
Price Incentives for Advances Executed Before Noon: In effect as of Tuesday, September 5, 2023, the FHLBNY is pleased to now offer price incentives for advances executed before Noon each business day. These pricing incentives offer an opportunity to provide economic value to our members, while improving cash and liquidity management for the FHLBNY. For further details, kindly refer to the Bulletin.
The Symmetrical Prepayment Advance Feature
For those anticipating term funding needs, and with rates on an uptrend, it can be an appropriate juncture to consider our SPA feature. This feature allows the member to capture, at prepayment, changes in the fair value of the advance which are favorable to the member. Contact Member Services Desk to discuss.
Looking for more information on the above topics? We’d love to speak with you!
Questions?
If you wish to receive the MSD Weekly Market Update in .pdf format (includes FHLBNY rate charts) or to discuss this content further, please email the MSD Team.