Member Services Desk
Weekly Market Update
This MSD Weekly Market Update reflects information for the week ending August 16, 2024.
Economist Views
Click to expand the below image.
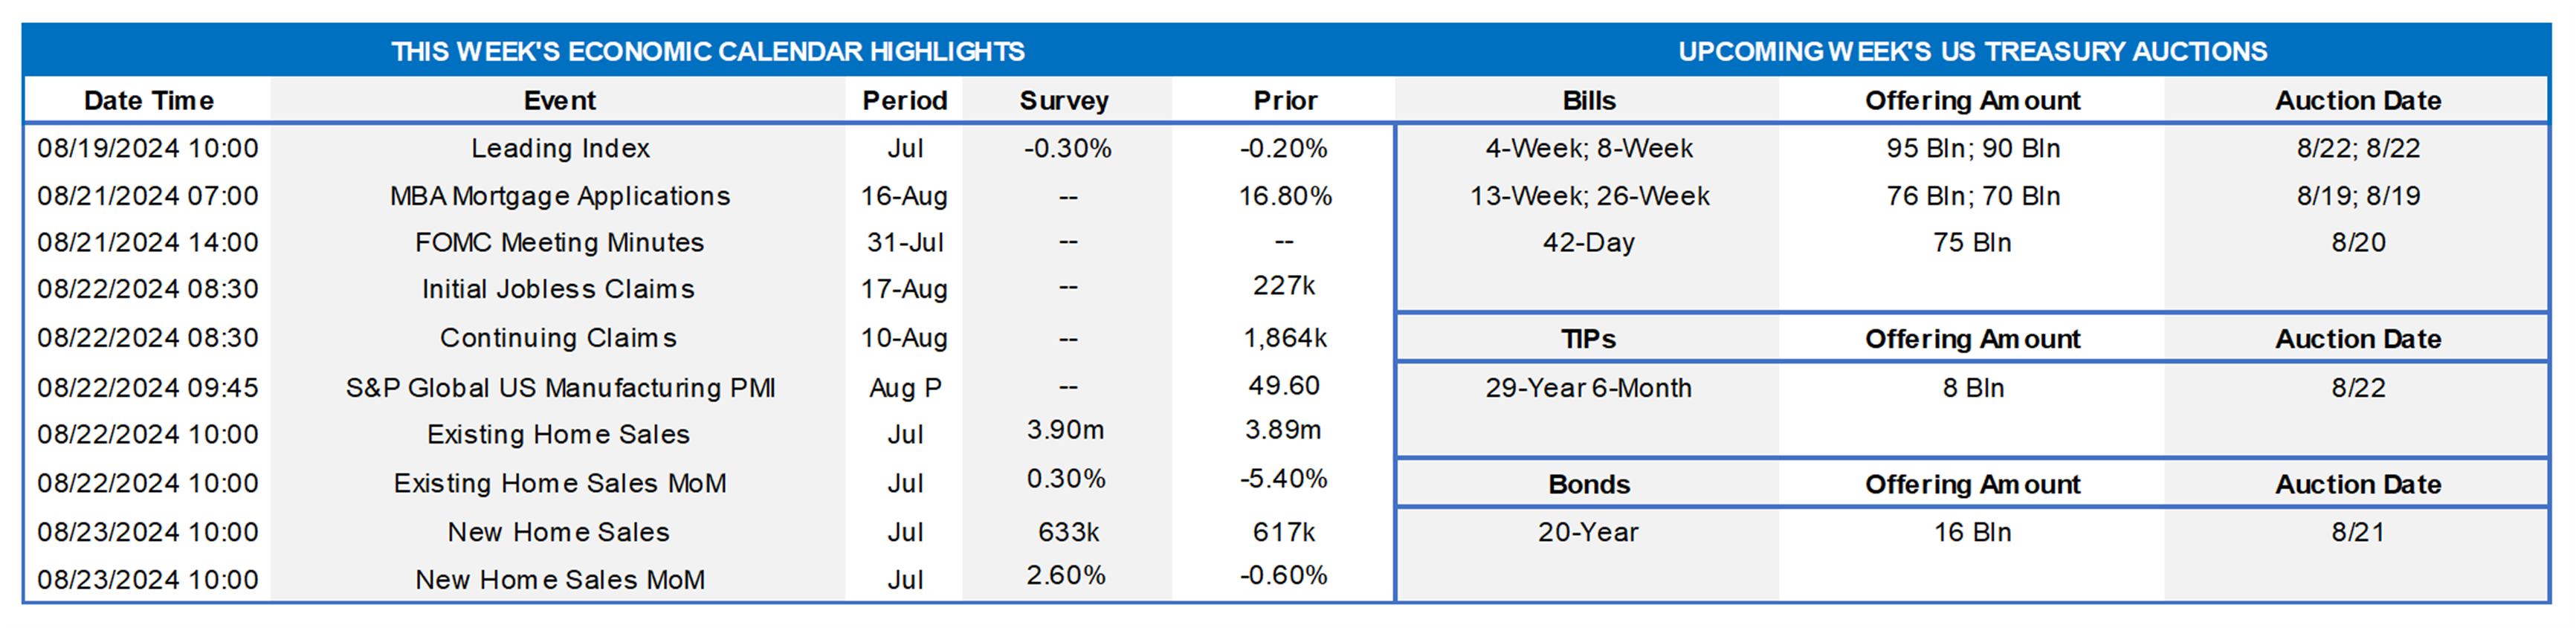
All eyes this upcoming week will be on Federal Reserve Chairman Jerome Powell at the Kansas City district’s annual economic policy symposium in Jackson Hole, Wyoming. The topic of this year’s conference will be Reassessing the Effectiveness and Transmission of Monetary Policy. Mr. Powell is widely expected to set the table for an initial cut in the federal funds rate target range at monetary policymakers’ mid-September meeting, although the size of any move likely will be determined by the August employment report to be released at the end of the following week. While not yet confirmed, Mr. Powell is expected to continue the tradition of the Fed Chair giving opening remarks on the morning of Friday, August 23. Market participants will enjoy an extremely light economic data calendar in the coming week. While there is little evidence that business activity is rolling over, the Index of Leading Economic Indicators probably moved lower once again last month. Existing and new home sales likely went their separate ways in July. The Department of Labor’s update on jobless claims will allow economists to bolster their projections for the August employment report. The minutes of the late-July Federal Open Market Committee (FOMC) may provide some insight into monetary policymakers’ current thinking.
Leading Indicators: The Conference Board’s gauge of prospective economic activity probably fell for a fifth straight month in July, dipping by .3% from June. There is little available evidence that the economy is in fact contracting, however. Indeed, a model constructed by the Federal Reserve Bank of St. Louis estimated that the probability that the economy was in recession in June at just .16%.
Jobless Claims: Initial claims for unemployment insurance benefits probably remained in the recent 230K-250K range during the filing period ended August 17. Keep a close eye on continuing claims, which have been steadily rising since mid-April, for additional signs that recently furloughed employees are having a more challenging time finding work. Given that the previous claims report sparked a rally in stocks and a backup in yields, this data point, while usually not that impactful, has the potential to spur a market move.
Existing Home Sales: A rebound in home-purchase contract signings over the May-June span suggests that closings nationwide probably rose by 1.9% to a seasonally adjusted annual rate of 3.96mn in June – the first increase since February. With the number of available homes on the market likely to expand by 3.8% to a nearly four-year high of 1.37mn on a not seasonally adjusted basis during the reference period, the supply at the estimated sales pace would move four ticks higher 4.1 months.
New Home Sales: Significantly above-average precipitation in July probably left contract signings on newly constructed dwellings below the 600K mark for the first time since November 2022.
Federal Reserve Appearances:
- Aug. 20 Atlanta Fed President Bostic to speak about innovating for inclusion at the Atlanta Fed’s Payment Inclusion Forum.
- Aug. 21 Federal Reserve to release the minutes from the July 30-31 FOMC meeting.
- Aug. 22 Federal Reserve Bank of Kansas City’s annual economic policy symposium in Jackson Hole, Wyoming.
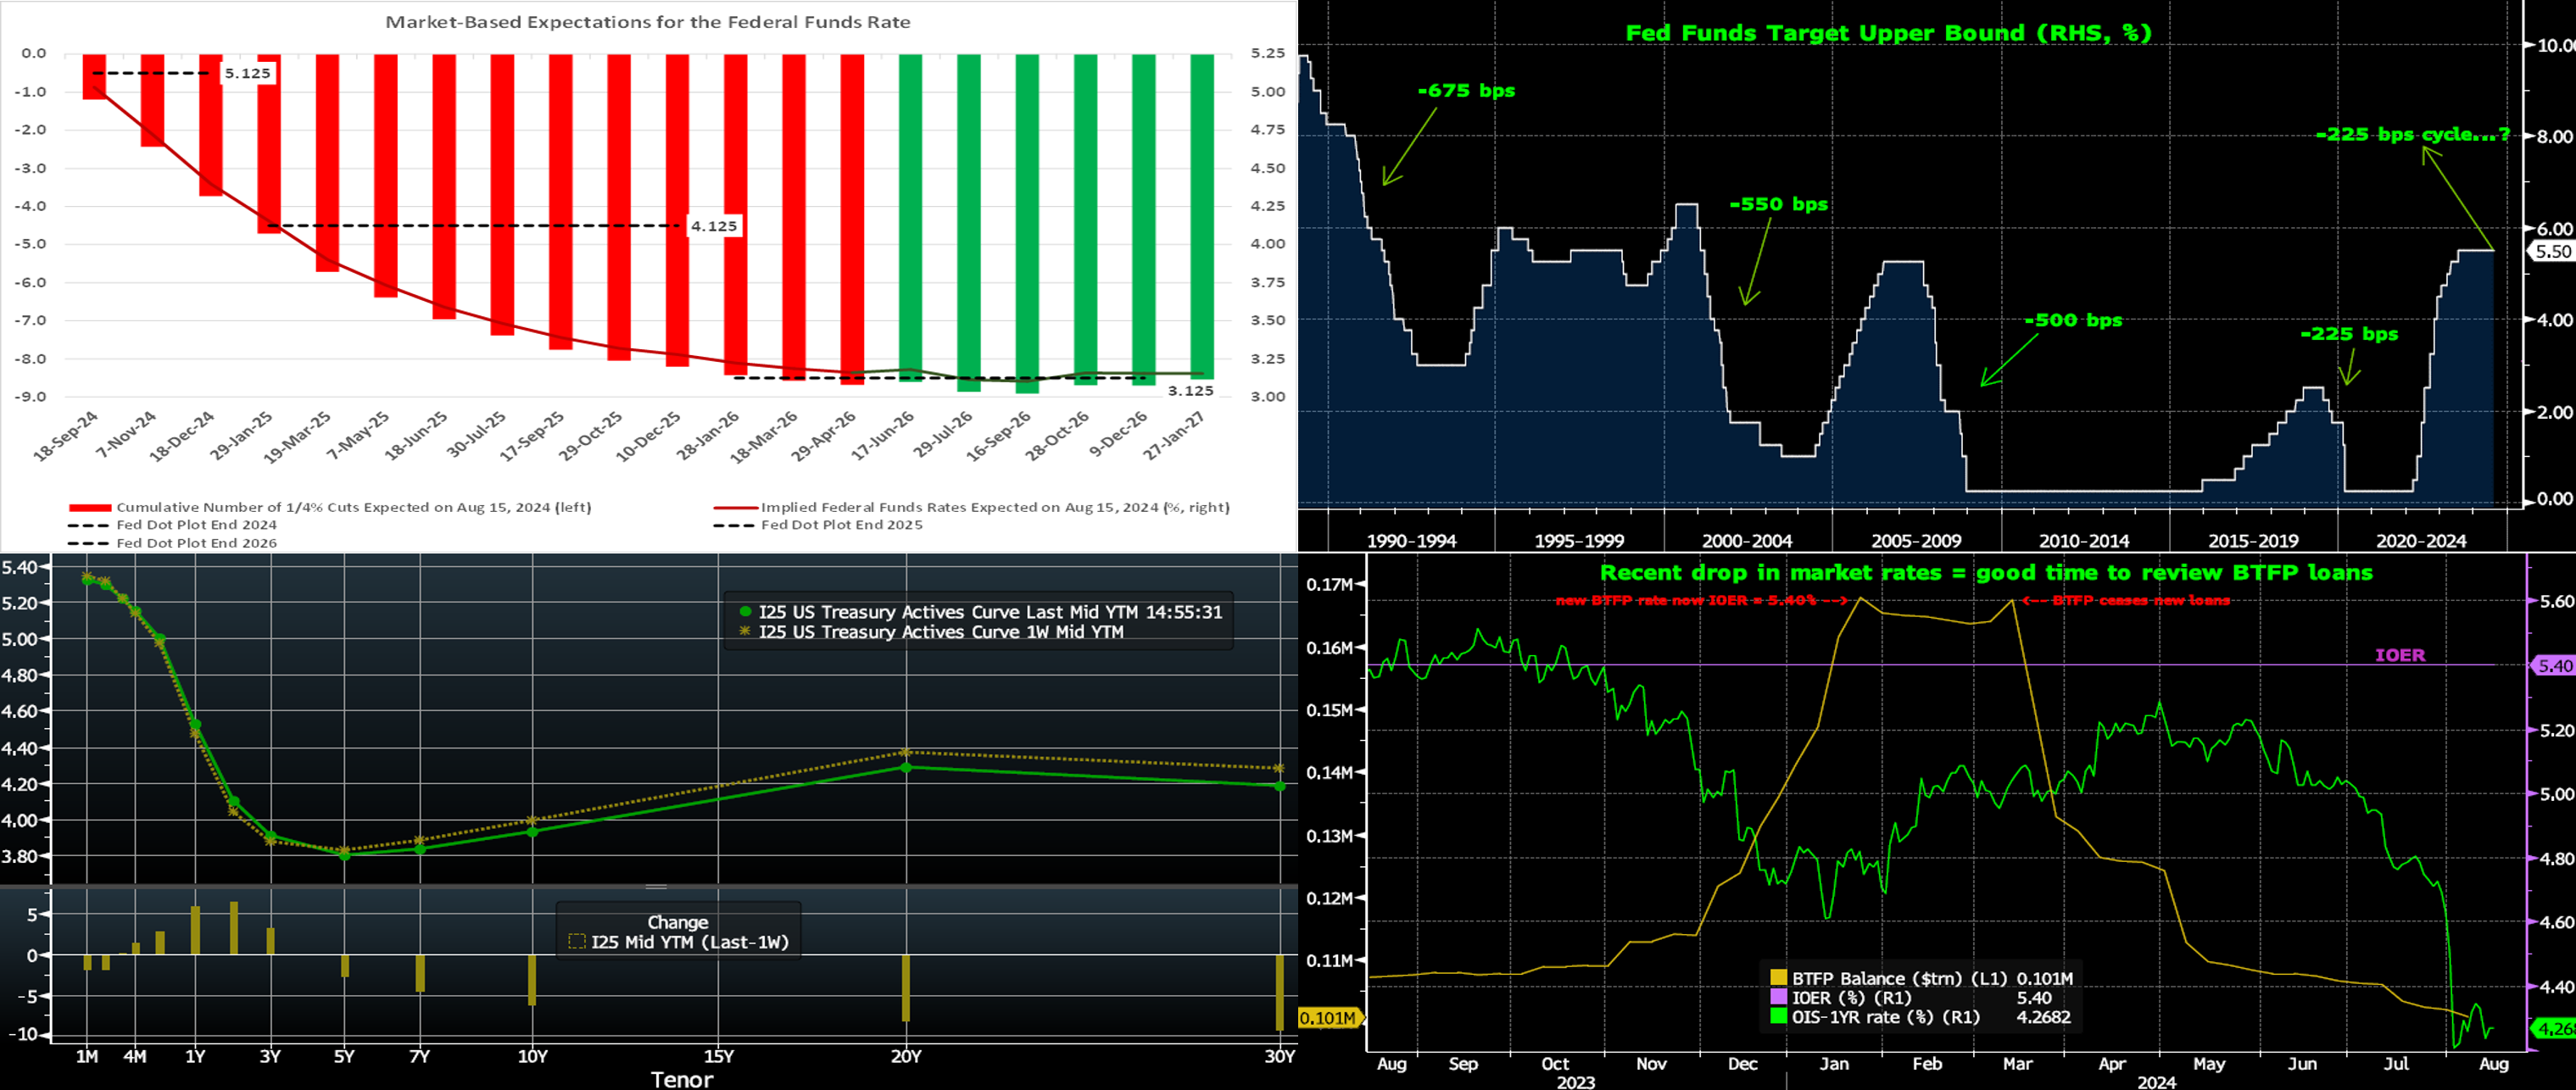
CHART 1 UPPER LEFT
Source: Bloomberg; Federal Reserve; FHLB-NY. The Fed released the calendar of FOMC meetings out to January 2027 last week. With two additional cycles of dates provided for a first time, we now have a complete profile of market-based expectations for the forthcoming policy easing cycle. As of midday Thursday, the market anticipates the equivalent of approximately 8½ 25-bps cuts that will bring the federal funds rate to a low of ~3.16% by April 2026, roughly a full percentage point below the forecast contained in the Fed’s dot plot (officially termed the Summary of Economic Projections) issued at the June FOMC meeting. Beyond that point, market participants are essentially looking for a period of stable policy, with the federal funds rate near the Fed’s yearend 2026 forecast from the June dot plot. In this regard, although the end-points are similar, the market prices for a faster pace of rate cuts relative to the Fed’s dot plot. A refreshed dot plot will be issued at the September 18th FOMC meeting.
CHART 2 UPPER RIGHT
Source: Bloomberg. For historical perspective on market pricing and Fed-easing cycles, shown here is a long-term view of the Fed Funds Upper Bound rate. Given the current upper bound of 5.50%, the market currently prices a peak-to-trough easing cycle over the next few years of ~225 bps. Such a cycle would be much less than prior episodes and would match the last cycle when rates were already at relatively low levels and so had less room to drop before hitting “emergency levels”. Naturally, each cycle maintains its own story and context. At this juncture, it appears that the Fed is poised to cut rates in September to protect a soft landing for the economy; indeed, success on this front would obviate the need for a larger round of cuts such as those experienced in prior cycles.
CHART 3 LOWER LEFT
Source: Bloomberg. Top pane is yield (LHS, %), bottom pane is change (LHS, bps). As of Thursday afternoon, the UST term curve was mixed and flatter from the week prior. The shortest tenors were up by 3 to 6 bps, but the 5-year-and-longer zone was ~2 to 8 bps lower in progressive fashion. Rates had dipped earlier in the week on friendly inflation data (PPI/CPI) but then rebounded notably higher, and the curve flattened, after Thursday’s robust retail sales data. In terms of market-implied pricing of the Fed, the market prices a 127% chance, down from 156% last week, of a 25 bps cut in September; in other words, that is a 27% chance of a 50 bps cut. For end-2024, the market now prices for fed funds at 4.41%, or ~12 bps lower than last week, which is equates to ~3.7 25-bps cuts.
CHART 4 LOWER RIGHT
Source: Bloomberg. Note: Pricing as of Wednesday COB. After this summer’s decline in rates, and if not done already, it could be an opportune juncture to assess any BTFP loans that your institution may hold. Shown here is the trend of the Fed’s BTFP balance (Gold, LHS, $trn) over the past year. It experienced a significant spike in late-2023 when it was still priced at 10 bps over the 1-year OIS rate (Green, RHS, %). The balance then tapered off after the January 24th announcement that pricing would be at no less than the Interest on Excess Reserves rate (Purple, IOER, RHS, %) which has been at 5.40% throughout the period. And thereafter the balance has declined since the March 11th cessation of new loans under the program and as existing loans rolled off. With the recent decline in rates, many of our advance rates may now compare favorably to those on existing BTFP loans. Naturally, a favorable comparison will depend on the terms of the BTFP loan and may also necessitate some extension in maturity on a new advance. It is also vital to incorporate the FHLB-NY dividend into comparisons, as the dividend can significantly reduce the “all-in” rate of an advance; indeed, our Q2 dividend of 9.50% was just announced this Thursday. Please contact the desk to obtain a copy of our “All-in Borrowing Tool” to aid in calculating a dividend-adjusted borrowing cost.
FHLBNY Advance Rates Observations
Front-End Rates
- Short-end rates, relative to a week ago, were mixed, with the 3-month-and-in sector unchanged to a bp or two lower but 4- to 6-month tenors higher by 3 or 4 bps. Thursday’s economic data and the market’s subsequent pricing of a less aggressive easing timeline caused the uptick in the longer tenors. Money Market Fund AUM remains robust and reached a fresh record last week, thereby helping demand for short paper. Net T-bill issuance has increased in recent weeks, but the supply/demand dynamic remains relatively sturdy, with FHLB paper tightening from levels of a week ago.
- The market’s focus will remain on economic data and the Jackson Hole symposium at the tail end of the week.
Term Rates
- The longer-term curve, generally mirroring moves in USTs and swaps, was mixed and flatter. Shorter tenors were 2 to 6 bps higher, whereas the 4-year-and-out sector was 1 to 9 bps lower. Kindly refer to the previous section for color on market dynamics and changes.
- On the UST term supply front, the upcoming week serves a 20-year nominal and a 10-year TIPS auction. Note that UST auctions usually occur at 1pm and can occasionally spur volatility around that time. Please contact the Member Service Desk for further information on market dynamics, rate levels, or products. Note that our “800 number” is again ready for use at 1-800-546-5101 option 1.
Small Business Recovery Grant (SBRG) Program: Starting July 29, 2024, the FHLB-NY will offer $5mn in grant funding under the 2024 SBRG Program. This program provides grant funds to benefit FHLB-NY members’ small businesses, including farms and non-profit customers. Via the program, members will be able to provide grants of up to $10,000 to qualifying small businesses that have faced challenges due to rates, inflation, supply-chain constraints, and/or rising energy costs. Funding will be limited to $50,000 per member.
The FHLBNY is pleased to announce the 2024 0% Development Advance (ZDA) Program, now available with a new streamlined submission process. This program provides members with subsidized funding in the form of interest rate credits to assist in originating loans or purchasing loans/investments that meet the eligibility criteria under the Business Development Advance (BDA), Climate Development Advance (CDA), Infrastructure Development Advance (IDA), or Tribal Development Advance (TDA). Please contact the Member Service Desk for information and/or visit our ZDA information page.
Price Incentives for Advances Executed Before Noon: In effect as of Tuesday, September 5, 2023, the FHLBNY is pleased to now offer price incentives for advances executed before Noon each business day. These pricing incentives offer an opportunity to provide economic value to our members, while improving cash and liquidity management for the FHLBNY. For further details, kindly refer to the Bulletin.
The Symmetrical Prepayment Advance Feature
For those anticipating term funding needs, and with rates on an uptrend, it can be an appropriate juncture to consider our SPA feature. This feature allows the member to capture, at prepayment, changes in the fair value of the advance which are favorable to the member. Contact Member Services Desk to discuss.
Looking for more information on the above topics? We’d love to speak with you!
Questions?
If you wish to receive the MSD Weekly Market Update in .pdf format (includes FHLBNY rate charts) or to discuss this content further, please email the MSD Team.