Member Services Desk
Weekly Market Update
This MSD Weekly Market Update reflects information for the week ending August 9, 2024.
Economist Views
Click to expand the below image.
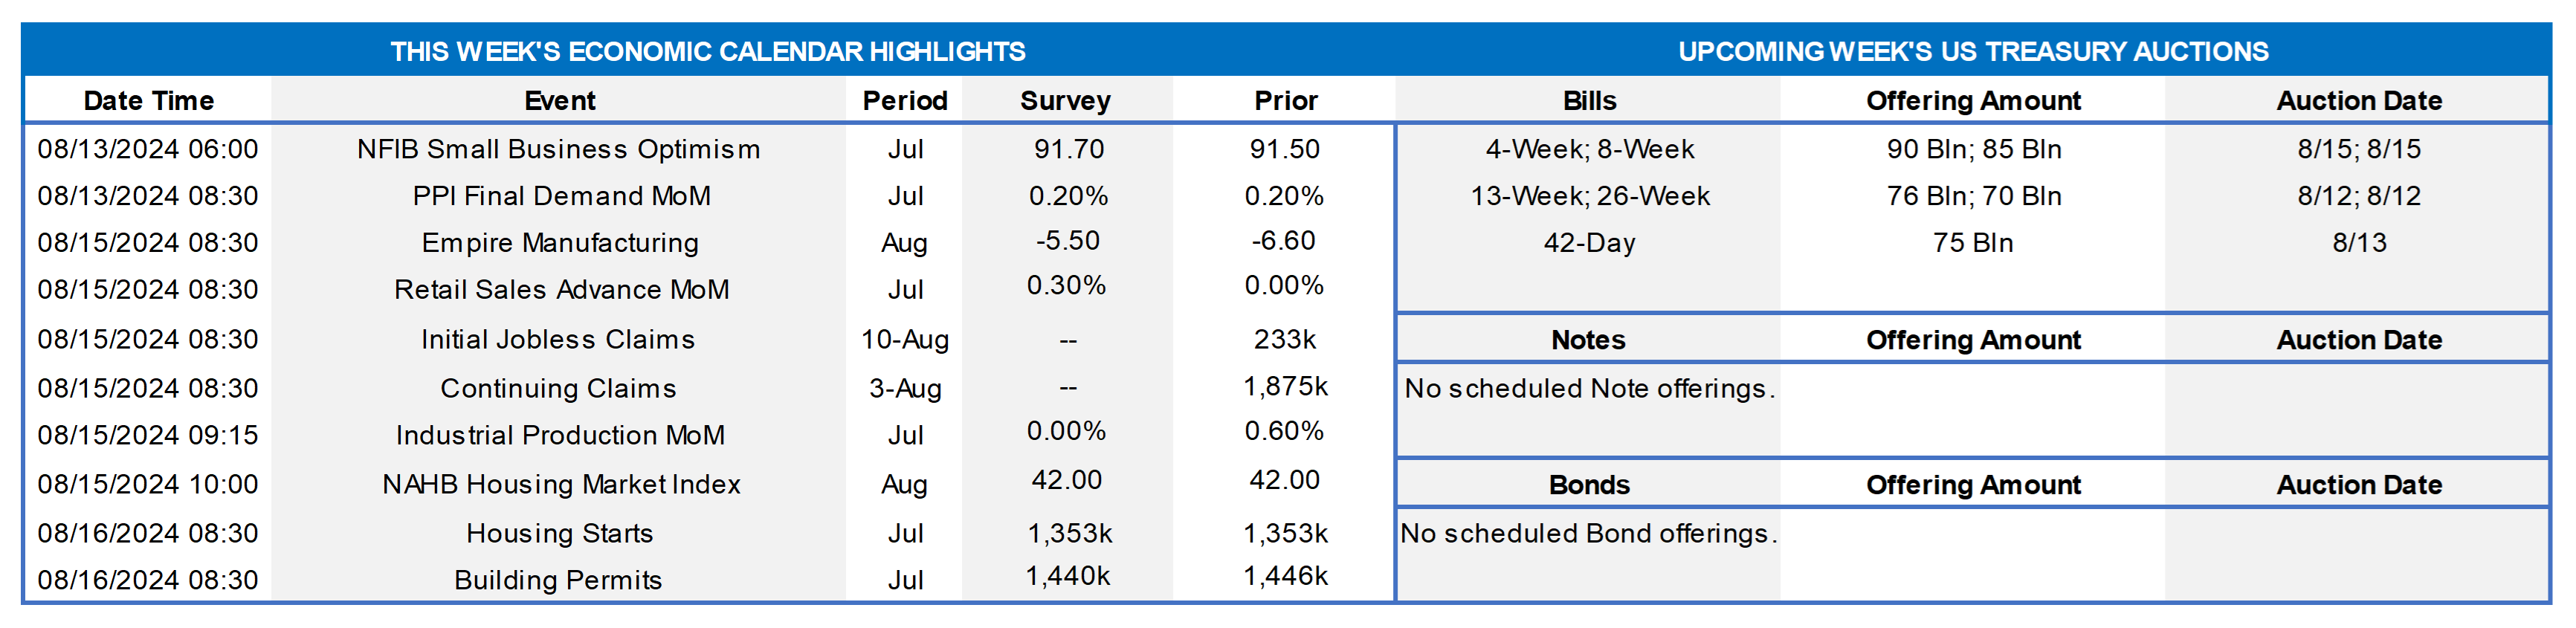
With the update on the employment side of the Fed’s dual mandate in the rear-view mirror, the market’s focus will turn to consumer inflation soundings for July. Driven by an anticipated modest pickup in core goods and services costs, the Consumer Price Index (CPI) likely edged .1% higher, erasing the surprising dip witnessed in June. Buoyed by a projected snapback in vehicle costs, the so-called core CPI excluding volatile food and energy components probably rose by .2%, after a .1% uptick in the previous month. Those projections, if realized, would place the overall and core CPIs 2.9% and 3.2% above their respective year-ago levels – both still above Federal Reserve’s desired 2% target. Upcoming reports on retail sales, industrial production, and residential building activity will allow economists to update their tracking estimates for current quarter real GDP growth, which are currently centered at an annual rate of 1.5%.
NFIB Small Business Optimism Index: Mirroring improvement seen in other data, the barometer probably moved one point higher to 92.5 – the highest reading since 93.1 posted in May 2022.
Producer Prices: Likely to rise by .2% again — Due to the echo of a sharp rise 12 months earlier, the year-to-year growth rate of headline PPI would jump from 2.6% to 4.1% if that forecast is accurate.
Empire State Manufacturing Survey: The contraction in activity in New York State likely continued for a ninth straight month in August, with the pace of deterioration likely quickening from that witnessed in July. Indeed, the general business conditions diffusion index – the net percentage of survey respondents noting a pickup in activity less those experiencing a decline – probably tumbled to a five-month low of -17.5% from -6.6% reading posted in the prior month.
Retail & Food Services Sales: Powered by an anticipated rebound in auto-dealer revenues, sales likely climbed by .7% in July, following no change in the previous month. Excluding a projected 3% jump in vehicle sales, purchases are expected to have edged .2% higher, after a .4% gain in June. As always, monitor so-called “control” sales excluding auto, building materials, and gas for early clues to the pace of Q3 consumer spending. Barring any prior-month revisions, a .1% uptick would leave core purchases 3.3% annualized above their Q2 average, essentially matching Q2’s 3.2% gain.
Jobless Claims: Initial claims for unemployment benefits probably remained on a saw-toothed path during the period ended August 3, rebounding to 240K from 233K the previous week. Focus on continuing claims, which rose to a nearly three-year high of 1.875mn during the week ended July 27, for signs that recently furloughed folks are having a more challenging time finding work.
Industrial Production & Capacity Utilization: A tug of war between a weather-related surge in utilities generation and weaker factory output probably left the gauge .5% lower in July, erasing all but a fraction of the .6% prior month’s gain. With additions to capacity expected to exceed output during the period, the capacity utilization rate probably moved one-half percentage point lower to 78.3%.
NAHB Housing Market Index: Buoyed by declines in rates, the sentiment gauge probably jumped to a neutral reading of 50 in August from the 42 in the preceding month.
Housing Starts & Building Permits: Hampered by unusually high rain levels, new housing units started and building permits filed probably tumbled to respective SAARs of 1.27mn and 1.35mn.
Michigan Consumer Sentiment Index: Concerns about current and prospective conditions triggered by a tepid jobs report probably left the barometer at a nine-month low of 64.5 in early August.
Federal Reserve Appearances:
- Aug. 13 Atlanta Fed President Bostic to speak on the outlook at the Conference of African American Financial Professionals.
- Aug. 15 Philadelphia Fed Pres Harker to give a speech on the Bank’s Center for the Restoration of Economic Data
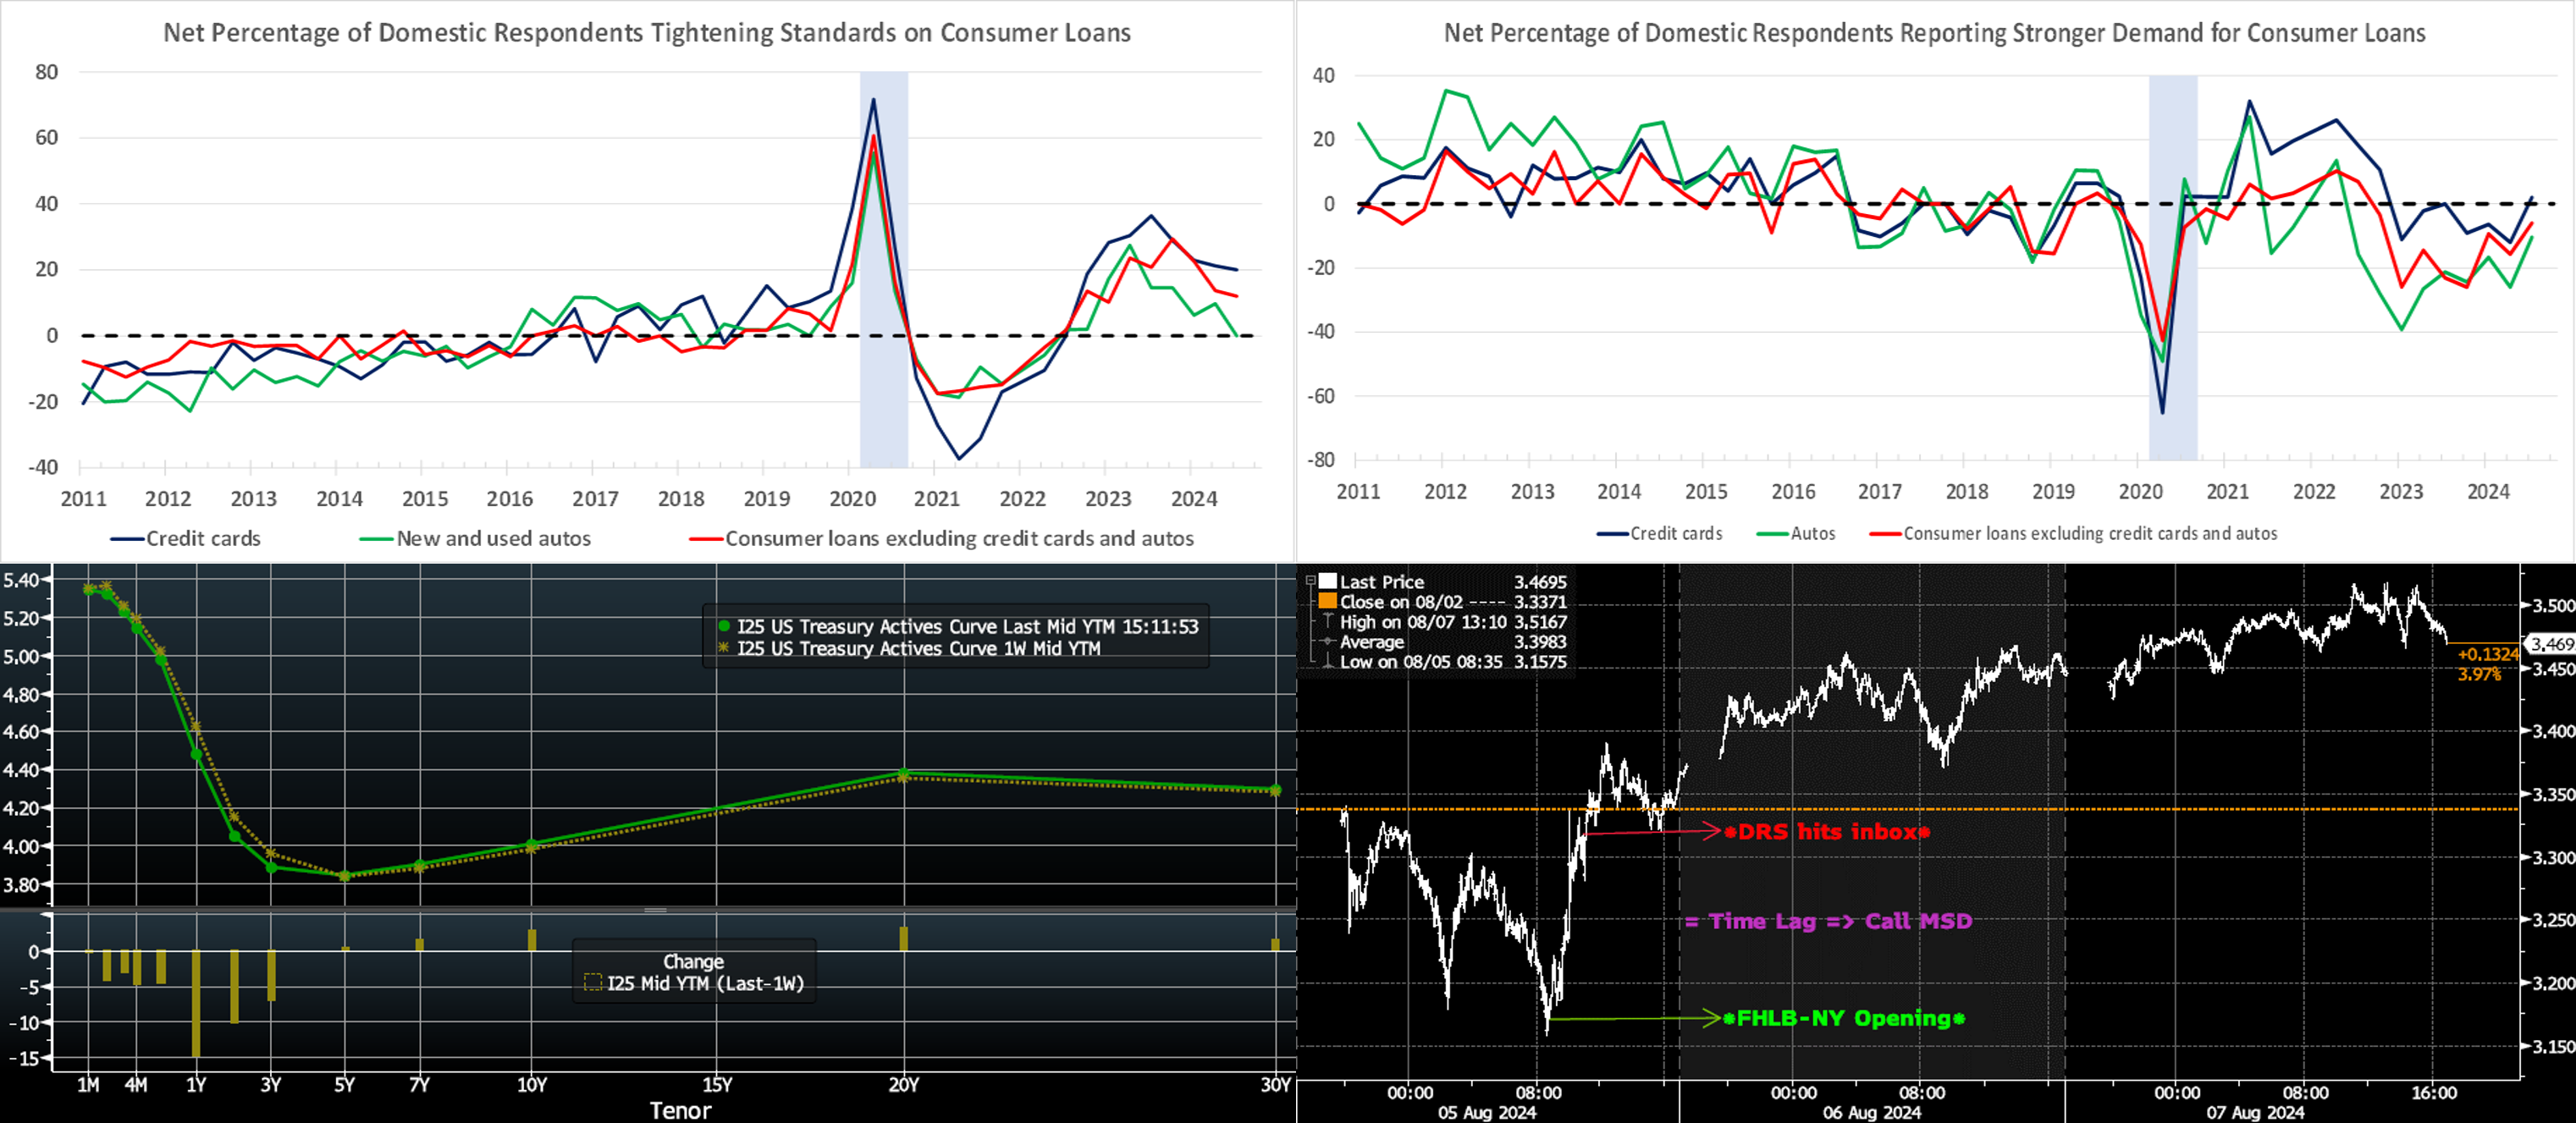
CHART 1 UPPER LEFT AND CHART 2 UPPER RIGHT
Source: Board of Governors of the Federal Reserve System; National Bureau of Economic Research; FHLB-NY. Note: Shaded areas denote recession. Released this past week, the Federal Reserve Board’s July 2024 Senior Loan Officer Opinion Survey on Bank Lending Practices (“SLOOS”) revealed, on balance, tighter standards and weaker demand across virtually all loan types. While banks reported having tightened lending standards further for most loan categories Q2, the net shares of banks that reported having tightened lending standards are lower than in Q1 across almost all loan categories. Focusing on the consumer, standards reportedly tightened for credit card and other consumer loans but remained basically unchanged for auto borrowings (Upper Left chart). Demand weakened further for auto and other consumer loans during the spring quarter but remained basically unchanged for credit card borrowings (Upper Right chart). The full SLOOS report, along with related data and charts, can be found at https://www.federalreserve.gov/data/sloos/sloos-202407.htm.
CHART 3 LOWER LEFT
Source: Bloomberg. Top pane is yield (LHS, %), bottom pane is change (LHS, bps). As of Thursday afternoon, the UST term curve was lower and steeper from last Thursday afternoon, with the shorter tenors leading yields lower. The 2-year was ~10 bps lower. It should be noted, however, that yields were substantially lower at the start of the week. For instance, the 2-year hit 3.71% early Monday but was trading ~4.04% as of this writing. Last Friday’s more tepid-than-expected jobs report had sent rates on a downward course. On Monday, equities and yields opened notably lower, as markets were flustered and subject to unwinds and stop-losses of “fast-money” trades; one flavor of these trades has been borrowing at low rates in Japanese Yen and then investing in higher-yielding USD assets. Added to the mix were geopolitical Mideast tensions which spurred flight-to-quality demand in USTs. Conditions calmed greatly over the rest of the week. In terms of market-implied pricing of the Fed, the market prices a 156% chance of a 25 bps cut in September; in other words, that is a 56% chance of a 50 bps cut. For end-2024, the market now prices for fed funds at 4.29%, or 104 bps, which is the equivalent of just over four cuts of 25 bps; this week’s pricing essentially added 19 bps of cumulative cuts for 2024. Reflecting how the market calmed over the course of the week, the curve had over five 25-bps cuts priced into it on Monday morning.
CHART 4 LOWER RIGHT
Source: Bloomberg. Here we serve our periodic reminder to contact the desk in times of market volatility. Shown here is the SOFR 5-year swap rate (RHS, %) in 5-minute intervals in the first few days of the week. After closing at 3.337% on August 2nd, it opened the week ~3.17% on the 5th, owing to market stress and volatility that spurred declines in both stocks and bond yields. Note that FHLB-NY is generally open for term business ~9 a.m. Also important to keep in mind is that our Daily Rate Sheet (“DRS”) is based on pricing from this opening timeframe; therefore, especially for term fixed rates, the DRS may reflect stale rates by the time it hits your inbox near 11 a.m. Our term rates move constantly with market rates. Given this dynamic, we highly encourage members to engage with the desk early and often to get fresh indications or live levels and potentially capture more advantageous funding levels to better serve your net interest margin metrics. We also encourage members to contact us for information and context on market moves. As of this writing on midday Thursday, the 5-year swap rate was ~3.53%.
FHLBNY Advance Rates Observations
Front-End Rates
- Short-end rates, relative to a week ago, were mixed but notably lower in longer tenors. The 1-month-and-in zone was 3 bps higher on average, mostly a result of somewhat wider spreads on short-end paper amid volatility early in the week. The 2- to 6-month sector, however, was 6 to 19 bps lower in progressive fashion out the curve, a result of the market’s pricing a more aggressive Fed-easing timeline. Money Market Fund AUM remains robust and reached a fresh record this week, after a few weeks of declines. Net T-bill issuance should increase in coming weeks, but the supply/demand dynamic remains relatively sturdy, with FHLB paper experiencing widening in the early-week market tumult but subsequently recovering and continuing to trade tight to T-bills.
- The market’s focus will remain on economic data and market dynamics.
Term Rates
- The longer-term curve, generally mirroring moves in USTs and swaps, was lower and steeper from last Thursday, with shorter tenors leading the way. The 2-year was ~10 bps lower but had traded much lower, to the tune of ~35 bps, at the start of the week. Please refer to the previous section for color on market dynamics and changes.
- On the UST term supply front, the upcoming week serves a reprieve from auctions. Note that UST auctions usually occur at 1pm and can occasionally spur volatility around that time. Please contact the Member Services Desk for further information on market dynamics, rate levels, or products. Note that our “800 number” is again ready for use at 1-800-546-5101 option 1.
Small Business Recovery Grant (SBRG) Program: Starting July 29, 2024, the FHLB-NY will offer $5mn in grant funding under the 2024 SBRG Program. This program provides grant funds to benefit FHLB-NY members’ small businesses, including farms and non-profit customers. Via the program, members will be able to provide grants of up to $10,000 to qualifying small businesses that have faced challenges due to rates, inflation, supply-chain constraints, and/or rising energy costs. Funding will be limited to $50,000 per member.
The FHLBNY is pleased to announce the 2024 0% Development Advance (ZDA) Program, now available with a new streamlined submission process. This program provides members with subsidized funding in the form of interest rate credits to assist in originating loans or purchasing loans/investments that meet the eligibility criteria under the Business Development Advance (BDA), Climate Development Advance (CDA), Infrastructure Development Advance (IDA), or Tribal Development Advance (TDA). Please contact the Member Service Desk for information and/or visit our ZDA information page.
Price Incentives for Advances Executed Before Noon: In effect as of Tuesday, September 5, 2023, the FHLBNY is pleased to now offer price incentives for advances executed before Noon each business day. These pricing incentives offer an opportunity to provide economic value to our members, while improving cash and liquidity management for the FHLBNY. For further details, kindly refer to the Bulletin.
The Symmetrical Prepayment Advance Feature
For those anticipating term funding needs, and with rates on an uptrend, it can be an appropriate juncture to consider our SPA feature. This feature allows the member to capture, at prepayment, changes in the fair value of the advance which are favorable to the member. Contact Member Services Desk to discuss.
Looking for more information on the above topics? We’d love to speak with you!
Questions?
If you wish to receive the MSD Weekly Market Update in .pdf format (includes FHLBNY rate charts) or to discuss this content further, please email the MSD Team.