Member Services Desk
Weekly Market Update
This MSD Weekly Market Update reflects information for the week of August 8, 2022.
Economist Views
Click to expand the below image.
The focus of market participants this upcoming week will shift from employment to the inflation side of the Federal Reserve’s dual mandate. Lower energy quotes, combined with anticipated decelerations in core goods and services costs, are expected to have capped the rise in the headline Consumer Price Index in July. Traders and investors are divided on whether policymakers will deliver a 50 or 75bps hike in the federal funds rate target range at the September 20-21 Federal Open Market Committee meeting. However, another full set of employment and inflation reports before that gathering, could materially alter current expectations.
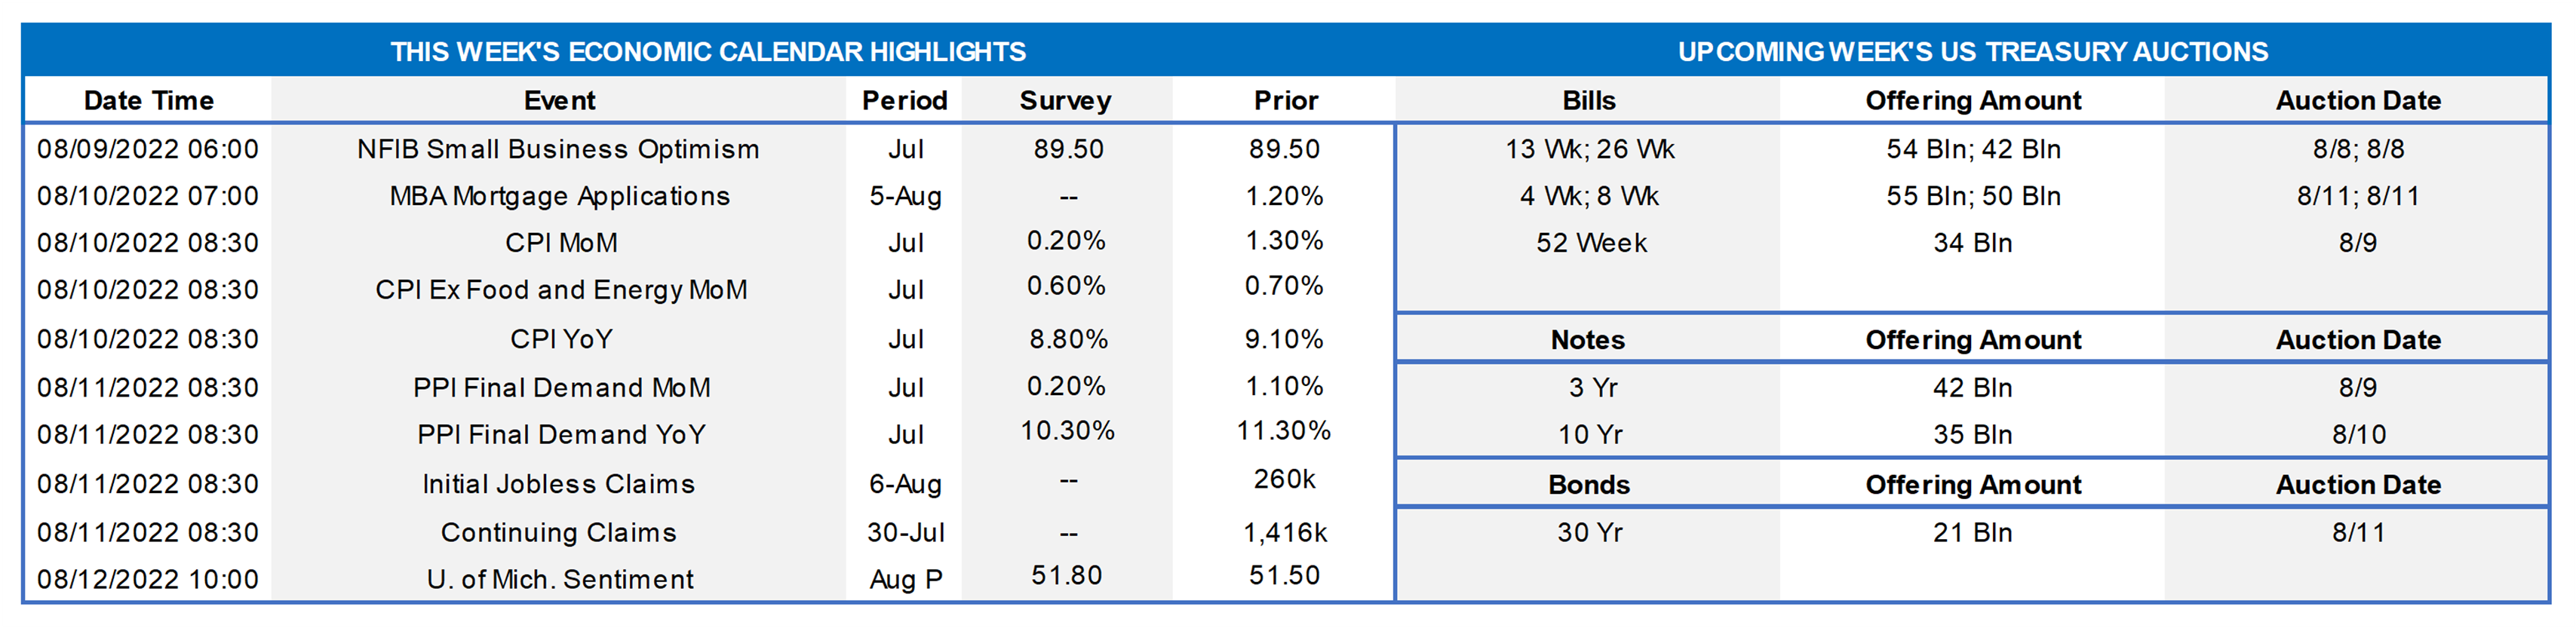
NFIB Small Business Optimism: Small business sentiment probably was little changed from the 9½-year low reading of 89.5 posted in June.
Nonfarm Productivity & Costs: With total hours worked eclipsing output growth once again during the spring, nonfarm business sector productivity likely contracted by 4.5% annualized, following a 7.3% falloff in Q1. Unit labor costs are expected to have risen at an annualized clip of 10% over the April-June span, after a 12.6% winter-quarter surge.
Consumer Prices: Capped by sharply lower retail energy costs, the CPI probably edged just .2% higher in July, marking the smallest monthly rise since January 2021. Excluding anticipated movements in volatile food and energy costs, the core CPI likely climbed by .5%, after a larger-than-expected 0.7% hike in June. The projections, if realized, would place the overall and core CPIs 8.8% and 6.1% above their respective year-ago level.
Producer Prices: Echoing the anticipated slowdown in consumer inflation, the Producer Price Index probably rose by .3% in July, following a 1.1% jump in June. That result would be consistent with a percentage-point slowdown in its annual growth rate to 10.3% in this week’s report.
Jobless Claims: Initial claims for unemployment insurance benefits likely remained in the recent 245-265K range during the period ended August 6. Pay particular attention to continuing claims under regular state programs, for signs that recently laid off employees may be having a more difficult time finding work.
Michigan Sentiment Consumer Index: The University of Michigan’s consumer confidence gauge probably improved slightly to 52.5 in early August but remained just marginally above the record low of 50 recorded in June.
Federal Reserve Appearances:
- Aug. 10 Chicago Fed President Evans to discuss the outlook at an event at Drake University in Des Moines, Iowa.
- Aug. 10 Minneapolis Fed President Kashkari to take part in a discussion on whether the U.S. is headed for stagflation.
- Aug. 11 San Francisco Fed President Mary Daly to be interviewed on Bloomberg Television.
Click to expand the below image.
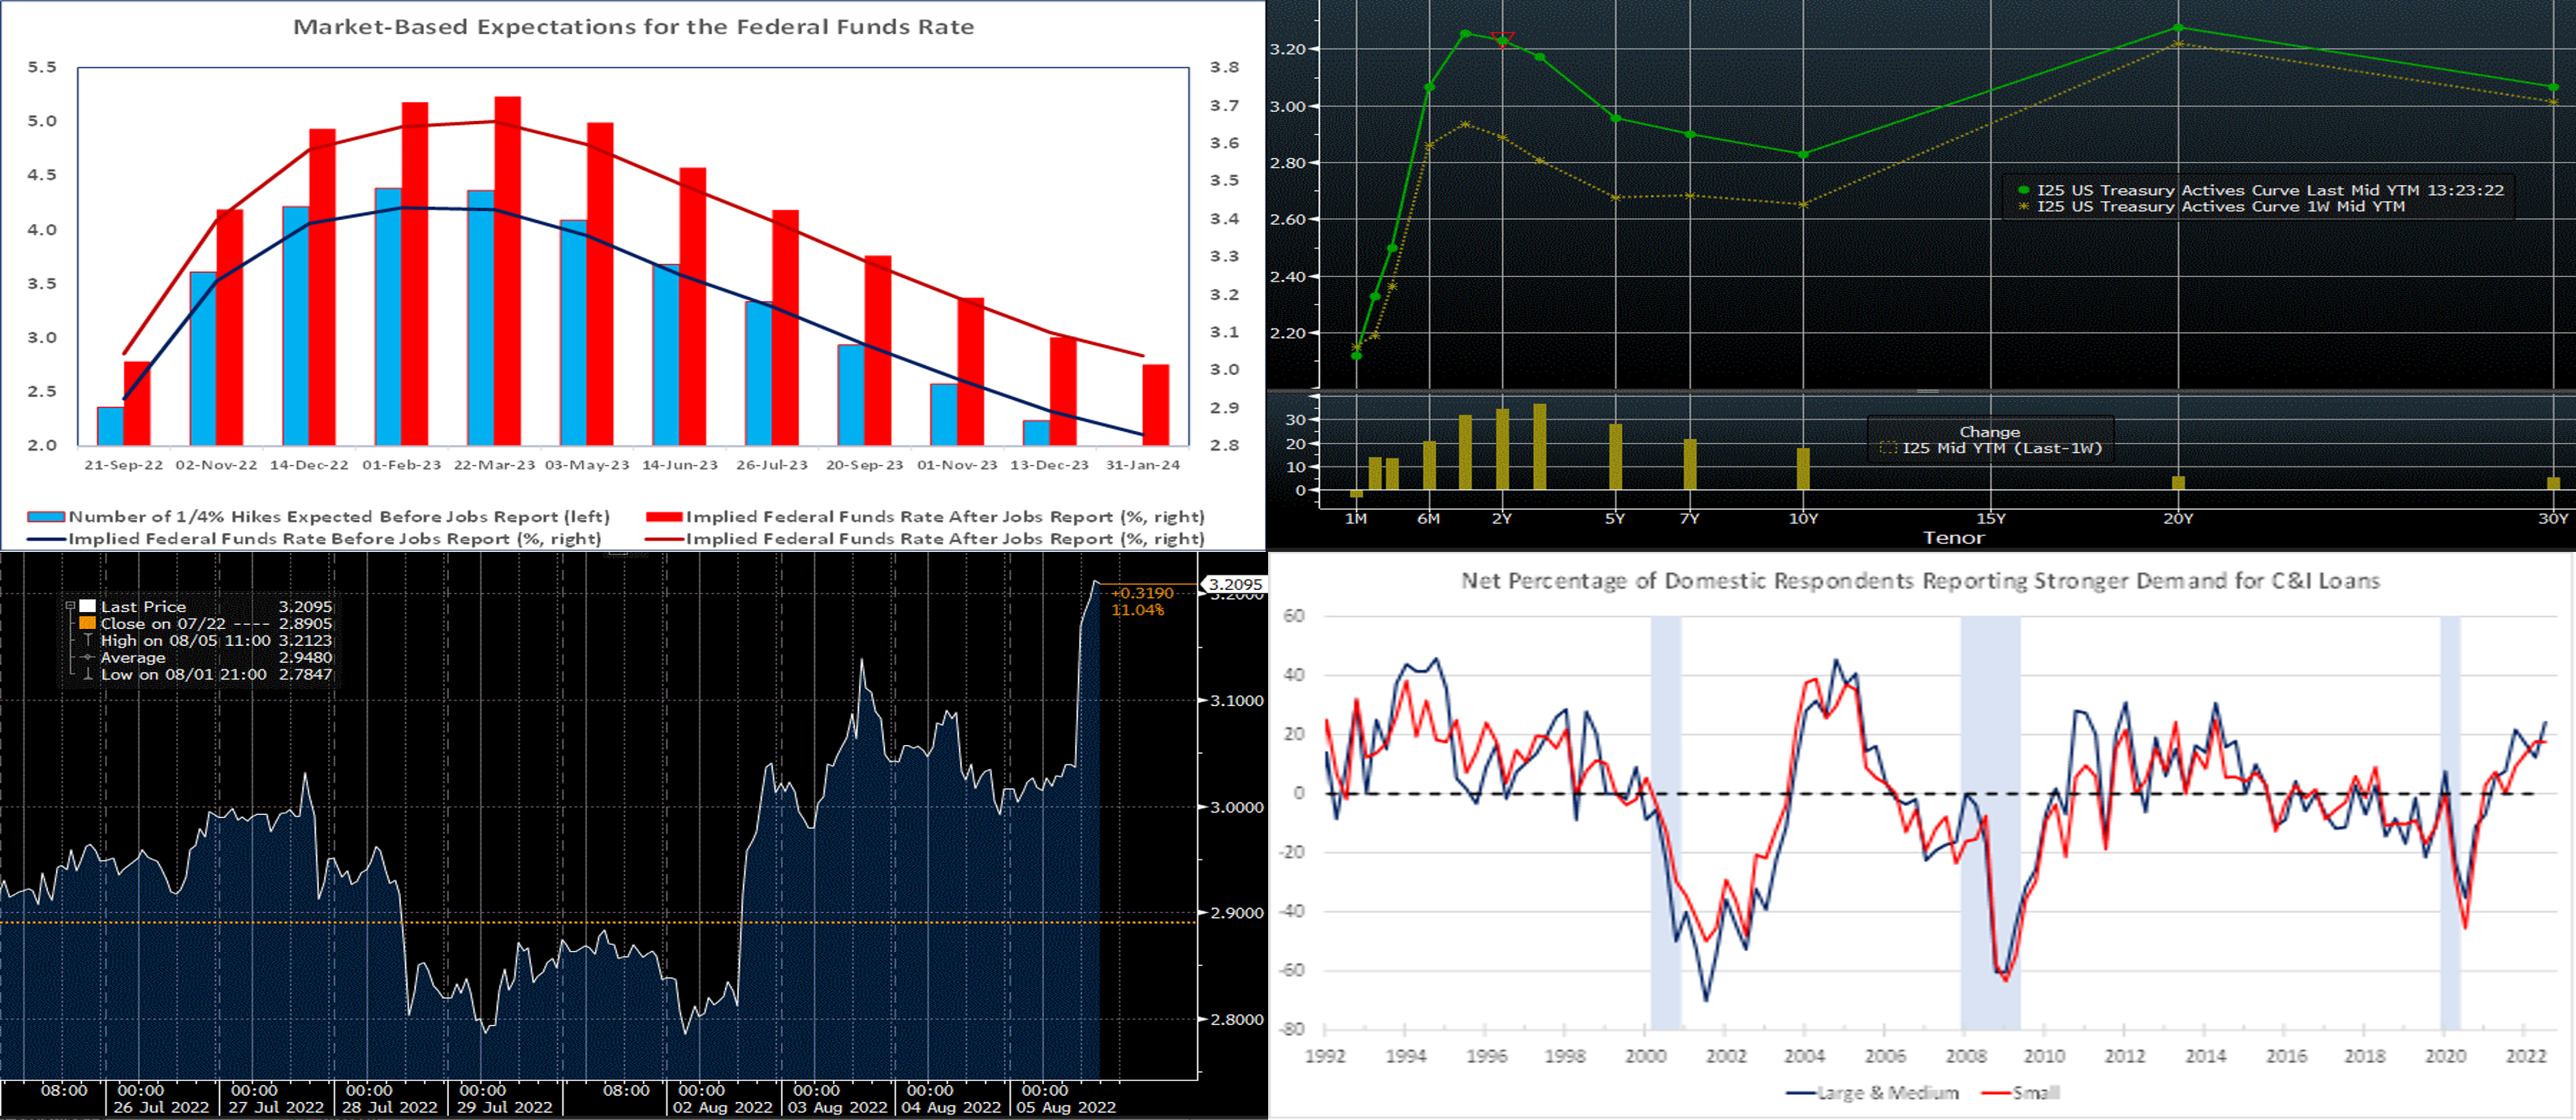
CHART 1 UPPER LEFT
Source: Bloomberg; FHLB-NY. This past Friday’s scorching employment report for July triggered a sizable repricing of expectations for prospective Fed Funds increases. Entering the jobs data, market participants had been leaning toward a more moderate 50 bps increase at the next FOMC meeting on September 20-21. News that 528K jobs had been added and that the unemployment rate dipped to an expansion-low 3.5% boosted the probability of another 75 bps hike on September 21st from ~35% to 80%. Market expectations remain at odds with those expressed by Fed officials in the “dot plot” issued after the June meeting, however. In contrast to policymakers’ forecasts for continued hikes over the course of this year and next, the market anticipates that the tightening cycle will be complete by next March.
CHART 2 UPPER RIGHT
Source: Bloomberg. Note: Top pane is yield (%), bottom pane is change (bps). In line with the above intelligence on the market’s re-assessment of the Fed hiking cycle, the UST curve “bear-flattened” significantly this past week, with 2 and 3-year tenors leading the way. Economic data, FOMC member comments, a Bank of England policy rate hike, and a heavy slate of corporate bond issuance all conspired to influence rates higher. The 2-year/10-year slope is now at its most inverted level since summer-2000! Below we focus on the 2-year point and add further market color. After a short reprieve from lofty levels of a few months ago, market volatility is percolating again, and so we encourage members to remain in touch with the desk for information and color.
CHART 3 LOWER LEFT
Source: Bloomberg. As we advised in our prior edition, rates will be highly subject to volatility upon fresh economic data and/or Fed comments hitting newswires. And this week clearly lived up to those expectations. Shown here is the 2-year SOFR interest rate swap, in 1-hour intervals, over the past 10 days. The 2-year maturity was chosen for illustration, because that point is heavily influenced by changes in the market’s pricing of Fed moves. As seen here, levels dipped from July 27th to August 2nd by ~25 bps, as the market had pared back pricing of Fed hikes and began pricing cuts into early-2023. But this pricing clearly reversed this past week, as hawkish Fed-speak and stronger-than-expected economic data propelled rates higher again; the 2-year rose ~43 bps from its early-week low. To reiterate, we encourage members to engage with the desk, in order to be aware of actual “live” advance levels and to potentially take advantage of movements.
CHART 4 LOWER RIGHT
Source: FRB; FHLB-NY. Released this past week, the July 2022 Senior Loan Officer Opinion Survey on Bank Lending Practices addressed changes in the standards and terms on, and demand for, bank loans to businesses and households over the past three months, which generally correspond to Q2 2022. As seen here, regarding loans to businesses, survey respondents reported stronger demand for commercial and industrial (C&I) loans to firms of all sizes over the second quarter. Given the decline in mortgage activity in recent months, the boost in C&I loan demand is surely a welcome development. While this survey may be slightly dated, it also, like the just released jobs report, strengthens the case that the economy is not currently in recessionary mode.
FHLBNY Advance Rates Observations
Front-End Rates
- Short-end Advance rates finished mixed and the curve steeper week-on-week. While 1-month-and-in rates dipped 2-3 bps, 3-month-and-out levels were 7 to 14 bps higher. This week’s more aggressive market pricing of forthcoming Fed hikes prompted the rise in the longer maturities. Short-end markets remain volatile, thereby leading to dynamic moves in rates both day-to-day and intraday, and this situation is likely to persist while the Fed embraces a “data-dependent” posture regarding the extent of future hikes. As of this past Friday midday, the market priced for a 100% chance of a 50 bps hike at the Sept.21st FOMC, with ~72% chance of a 75 bps hike. For 2022 cumulatively from here, the market fully prices 100 bps of hikes, with ~84% chance of 125 bps.
- Given the Fed’s tightening and data-dependent posture, rates will remain highly responsive to economic data and Fed-speak.
Term Rates
- The longer-term curve finished notably higher and flatter week-over-week, generally mirroring the move in UST and swaps markets. While the 2-year was ~34 bps higher, 5-year finished ~24 bps higher. Kindly refer to the previous section for relevant market color. The advance curve is extremely flat overall and inverted out to 5-year, thereby offering opportunities to extend in advance duration for minimal or lower coupon cost.
- On the UST term supply front, this upcoming week carries 3/10/30-year auctions. Market focus will remain on data, particularly Wednesday’s CPI report. Please call the desk for information on market dynamics, rate levels, or products.
Product Alert: FHLBNY is pleased to announce enhancements to our Advance Rebate Program, which provides members an opportunity to receive a cash rebate when prepaying an eligible advance and rebooking a new advance within a 30-day period. Rebate-eligible advances now must have a minimum of 6-months (reduced from 1-year) remaining. Moreover, the potential cash rebate has been increased. This program can be suitable for those wishing to extend their liability duration and/or potentially improve net interest margin. Please call the Member Service Desk at (212) 441-6600 for more information.
Forward Start Advance (FSA): For members with upcoming borrowing or refunding plans, consider the FSA as a method to opportunistically “lock in” rates before advance settlement date. Please call the Member Service Desk at (212) 441-6600 for more information.
The Symmetrical Prepayment Advance Feature
With rates at or near multi-year lows, it is a compelling juncture to use the SPA feature on term advances. This feature allows member to capture, at prepayment, changes in the Fair Value of the advance which are favorable to the member. Contact us to discuss.
Looking for more information on the above topics? We’d love to speak with you!
Questions?
If you wish to receive the MSD Weekly Market Update in .pdf format (includes FHLBNY rate charts) or to discuss this content further, please email the MSD Team.