Member Services Desk
Weekly Market Update
This MSD Weekly Market Update reflects information for the week ending August 2, 2024.
Economist Views
Click to expand the below image.
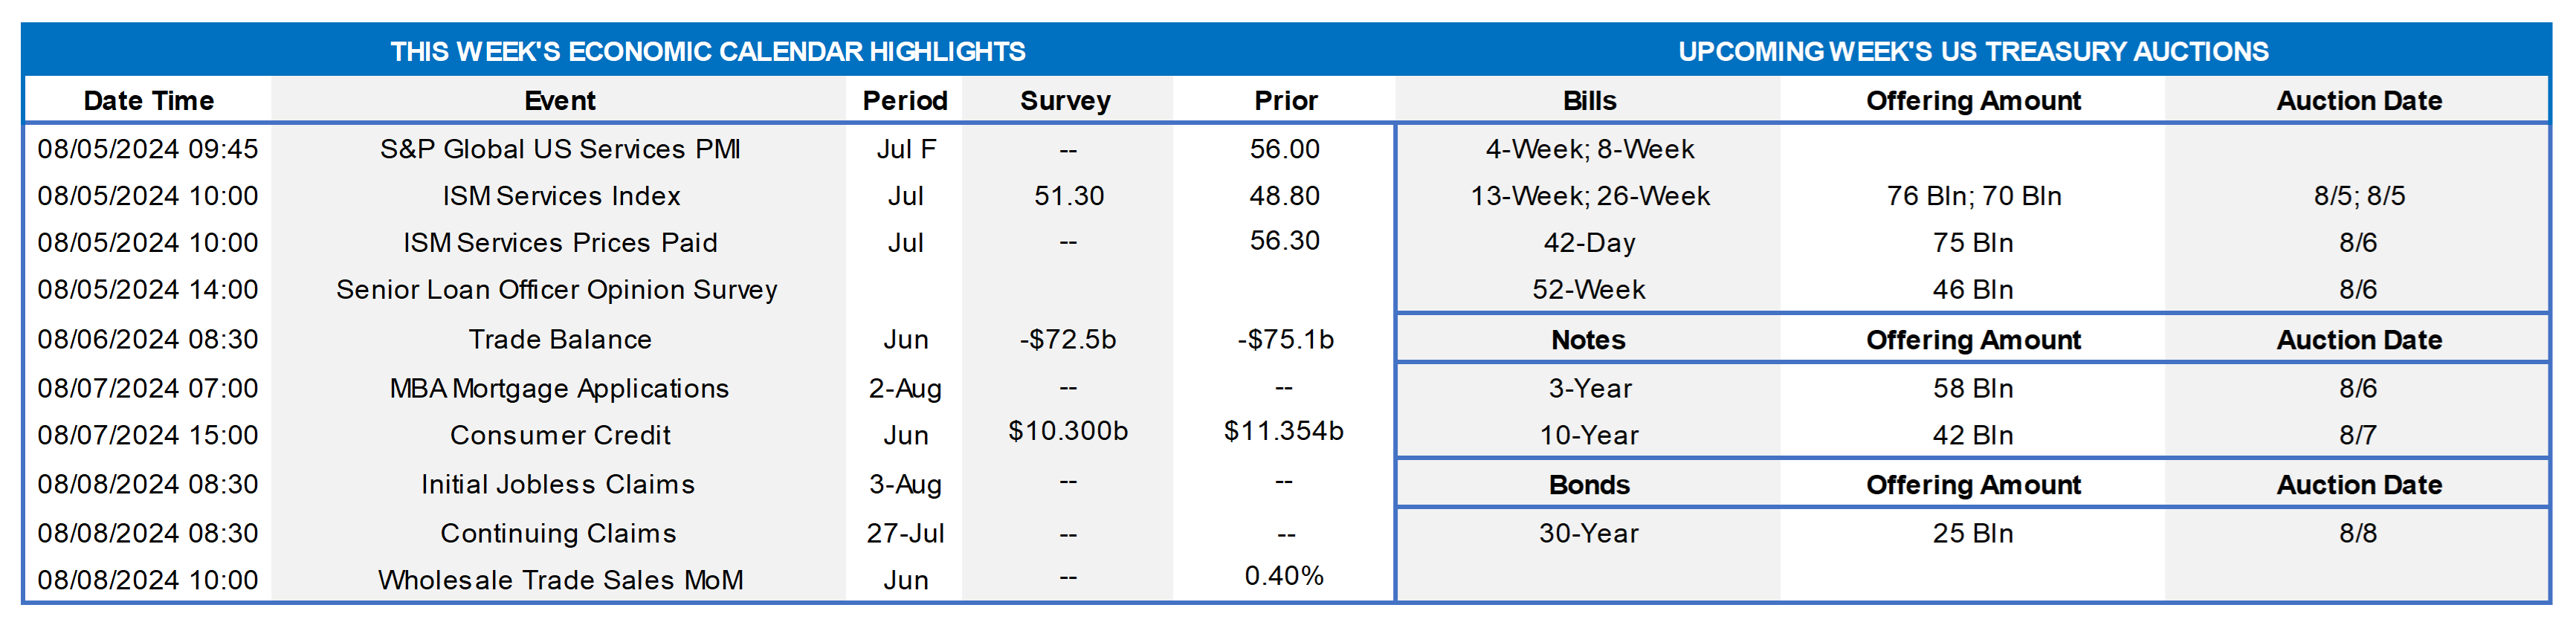
Having weathered the latest Federal Open Market Committee meeting and updates on the employment situation and manufacturing activity in July, market participants will contend with light data and speech calendars this week. In contrast to the factory barometer, the Institute for Supply Management’s gauge of service-producing activity likely rebounded last month. Hinting at a potential upward revision to Q2 real GDP growth, the international trade gap probably closed in June. Consumers are expected to have taken down a marginally lower amount of debt at the end of the spring than in May. Jobless claims probably dipped last week but remained consistent with a further slowdown in hiring in August. The Federal Reserve is scheduled to release its quarterly update on commercial bank lending practices. A pair of district Federal Reserve Bank Presidents, both FOMC voters, will provide their current thoughts on the economic outlook and monetary policy.
ISM Services Activity Index: The expansion in service-producing activity probably resumed in July, with the barometer rebounding to 53.5% from a contractionary reading of 48.8% in June.
International Trade Balance: Prompted by an export-led narrowing of the merchandise trade deficit, the shortfall on international trade in goods and services likely narrowed to a three-month low of $73bn in June from $75.1bn in the prior month.
Consumer Credit: Buoyed by an anticipated pickup in nonrevolving loan growth, installment credit likely grew by $10.5bn in June, almost matching the $11.4bn growth witnessed in the prior month.
Jobless Claims: Initial claims for unemployment insurance benefits probably remained on a saw-toothed path during the filing period ended August 3, retreating to 240K from 249K in the previous week. Keep a close eye on continuing claims, which rose to a nearly three-year high of 1.88mn during the week ended July 20, for additional signs that recently furloughed employees are indeed having a more difficult time finding work.
Federal Reserve Appearances:
- Aug. 5 Senior Loan Officer Opinion Survey on Bank Lending Practices.
- Aug. 5 San Francisco Fed President Daly to speak about monetary policy and the economy with the Hawaii Executive Collaborative.
- Aug. 8 Richmond Fed President Thomas Barkin to speak at a NABE webinar.
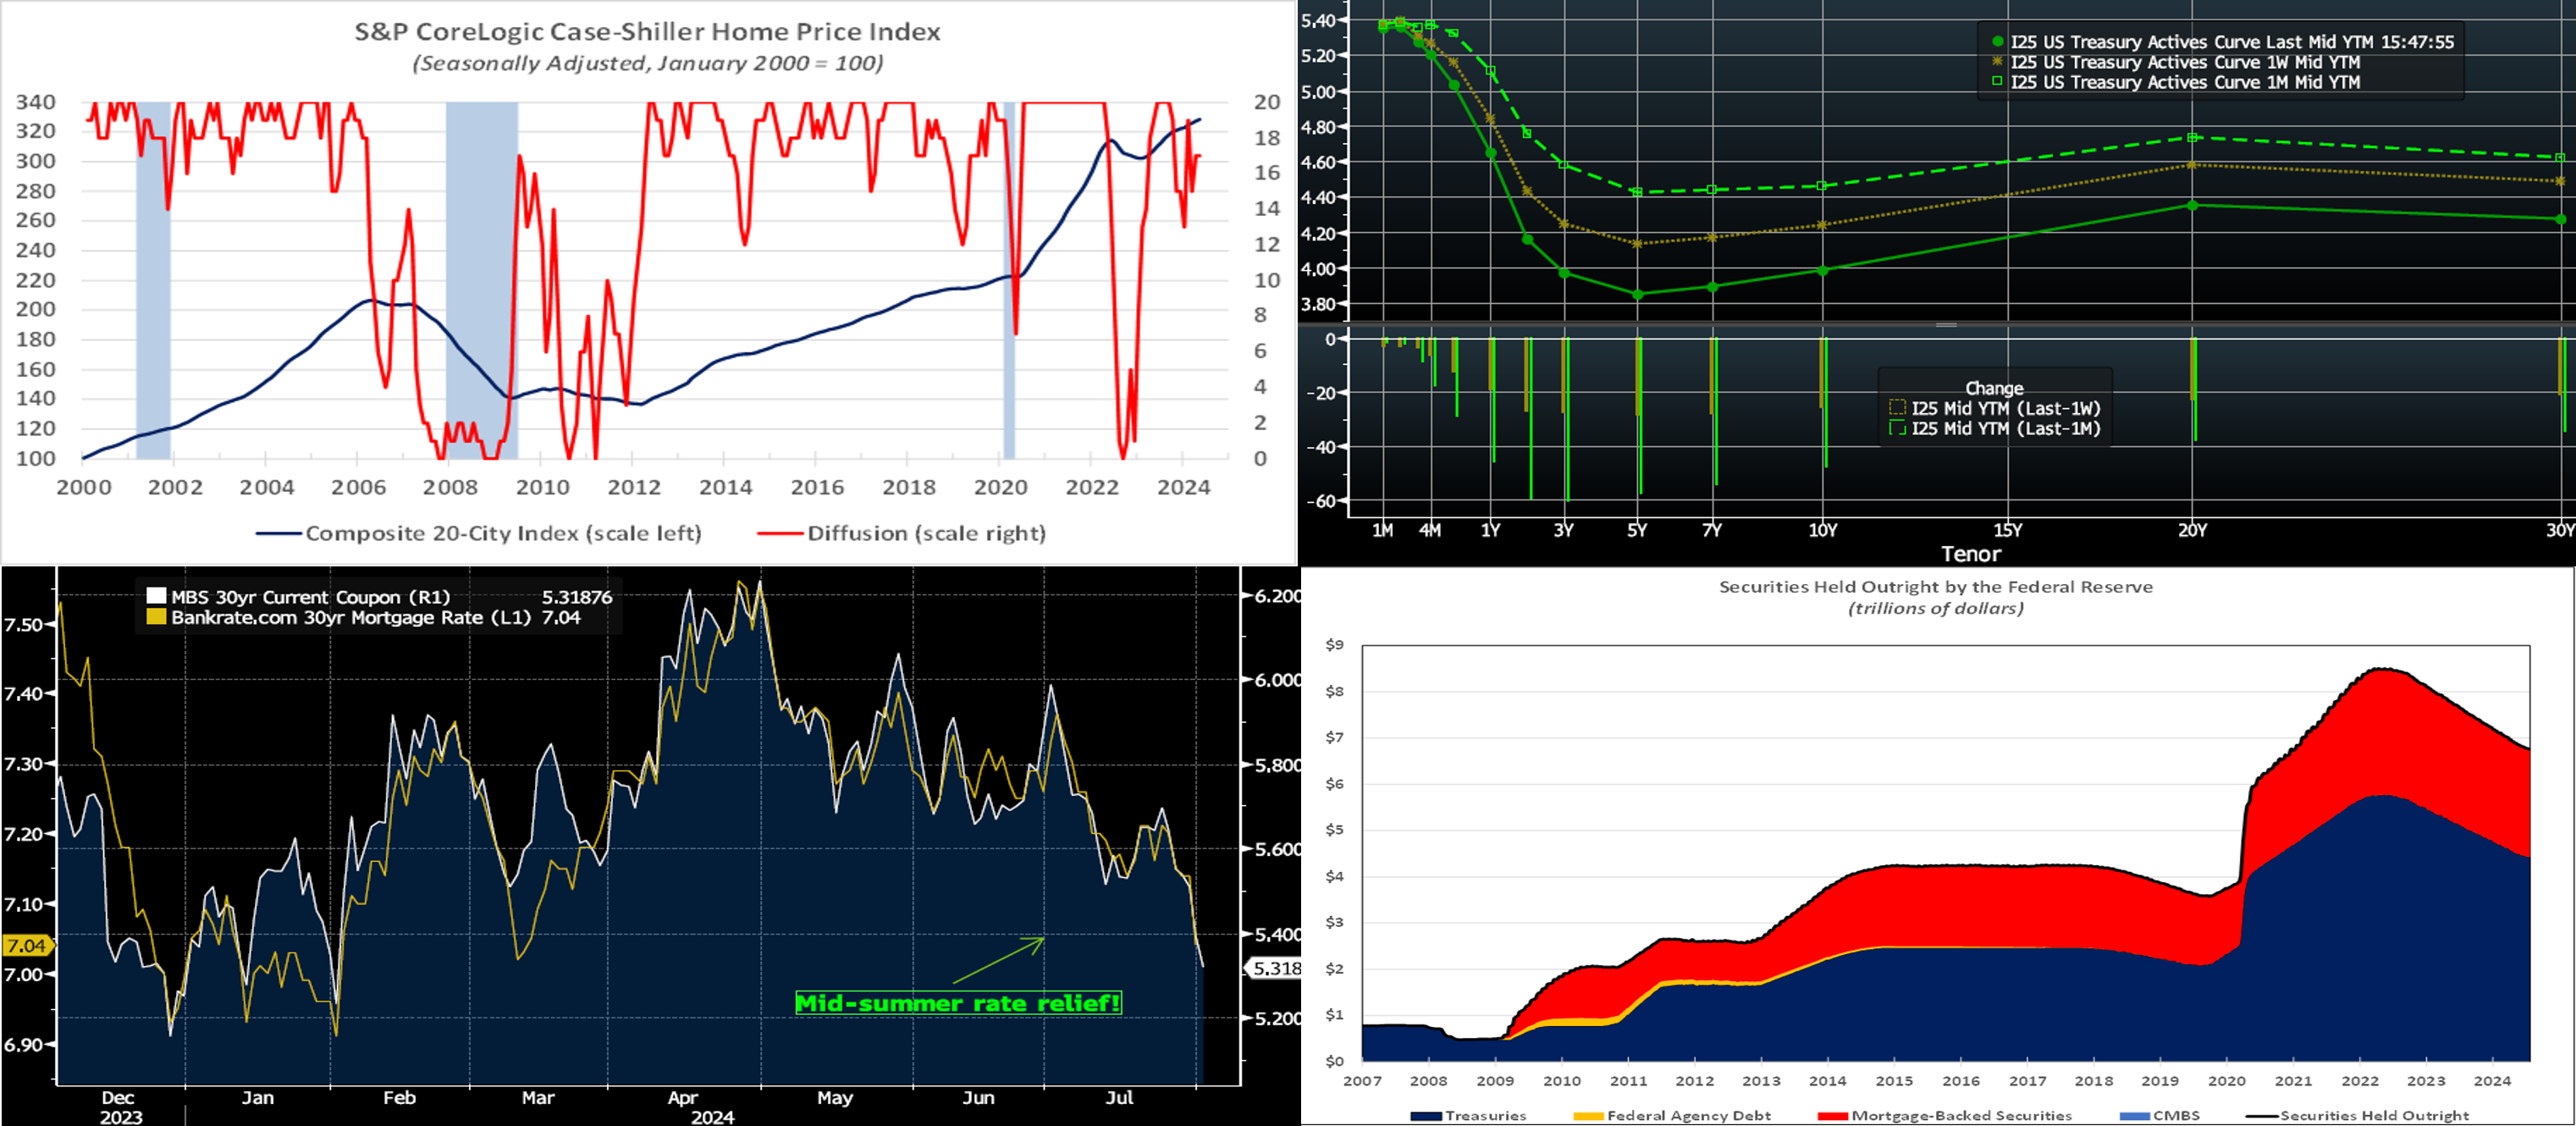
CHART 1 UPPER LEFT
Source: Standard & Poor’s; National Bureau of Economic Research; FHLB-NY. Note: Shaded areas denote recessions. Home selling prices rose for a 15th consecutive month in May across the major metropolitan areas covered by the S&P CoreLogic Case-Shiller (SPCLCS) 20-City Home Price Index. The average selling price climbed by .34% during the reference period, following a .39% gain in April. Over the latest 12 months available, the SPCLCS barometer has increased by 6.7%, eclipsing the 2.1% rise in consumer prices excluding shelter costs nationwide since May 2023. Home prices in the New York metropolitan area have surged by an even larger 9.3% since May 2023, and by 6.4% in real terms when adjusted for local consumer price inflation.
CHART 2 UPPER RIGHT
Source: Bloomberg. Top pane is yield (LHS, %), bottom pane is change (LHS, bps). As of Thursday afternoon, the UST term curve notably declined from the week prior, with the 3- to 10-year zone leading the way and falling nearly 30 bps. The main event of the week was the FOMC which, while not overtly dovish, nonetheless left the impression that a cut was forthcoming in September. Meanwhile, economic data was generally “soft landing”-friendly. Added to the mix were geopolitical Mideast tensions which spurred flight-to-quality demand in USTs. Rates have declined markedly in the past month, as can be seen here. In terms of market-implied pricing of the Fed, the market prices a 129% chance of a 25 bps cut in September; in other words, that is a 29% chance of a 50 bps cut. For end-2024, the market now prices for fed funds at 4.48%, or 85 bps which is the equivalent of ~3.4 cuts of 25 bps.
CHART 3 LOWER LEFT
Source: Bloomberg. The notable decline in yields of the past month has also been experienced in mortgage-based product. Shown here is the 30-year MBS Current Coupon (RHS, White, %, market-based imputed yield of a par-priced MBS) vs. the Bankrate.com 30-year average mortgage rate (LHS, Gold, %). Since the start of July, the former has dipped by ~66 bps to 5.32%, as of August 1 afternoon. The latter, in turn, had declined to 7.04% on July 31 and can be expected to fall a further 10 to 15 bps based on the market move of this past Thursday. Such a move would bring mortgage rates back to the lows of early 2024 near 6.90%.
CHART 4 LOWER RIGHT
Source: Board of Governors of the Federal Reserve System; FHLB-NY. The FOMC this past Wednesday decided to continue to reduce the Fed’s holdings of UST and agency debt and agency MBS at the pace set out at the April meeting, with monthly redemption caps unaltered at $25bn for USTs and $35bn for agency debt and agency MBS. To date, runoffs of maturing securities have pared the System Open Market Account, or SOMA, to $6.758trn from the $8.505trn peak reached in April 2022. In essence, this tightening and reduction of funds in the financial system has been maintained at least in part for the Fed to re-position itself for the future and be ready to use its securities purchasing tool again if necessary.
FHLBNY Advance Rates Observations
Front-End Rates
- Short-end rates, relative to a week ago, were mostly unchanged in the shortest tenors but 2 to 7 bps lower in the 2-month-and-out tenors. The market’s pricing of a more aggressive Fed easing timeline influenced the dip in this section of the curve. Meanwhile, Money Market Fund AUM has remains sturdy, thereby helping short paper. Net T-bill issuance is expected to accelerate further in the next month, but the supply/demand dynamic in the short-end remains solid, with FHLB paper continuing to trade tight to T-bills.
- The market’s focus will return to economic data, given the FOMC is now in the rearview mirror.
Term Rates
- The longer-term curve, generally mirroring moves in USTs and swaps, was significantly lower from a week ago. The 5-year led the move and was ~35 bps lower, with other tenors also notably lower but to a slightly lesser degree. Please refer to the previous section for color on the changes.
- On the UST term supply front, the upcoming week serves a slate of 3/10/30-year auctions. Note that UST auctions usually occur at 1pm and can occasionally spur volatility around that time. Please contact the Member Services Desk for further information on market dynamics, rate levels, or products. Note that our “800 number” is again ready for use at 1-800-546-5101 option 1.
The FHLBNY is pleased to announce the 2024 0% Development Advance (ZDA) Program, now available with a new streamlined submission process. This program provides members with subsidized funding in the form of interest rate credits to assist in originating loans or purchasing loans/investments that meet the eligibility criteria under the Business Development Advance (BDA), Climate Development Advance (CDA), Infrastructure Development Advance (IDA), or Tribal Development Advance (TDA). Please contact the Member Service Desk for information and/or visit our ZDA information page.
Price Incentives for Advances Executed Before Noon: In effect as of Tuesday, September 5, 2023, the FHLBNY is pleased to now offer price incentives for advances executed before Noon each business day. These pricing incentives offer an opportunity to provide economic value to our members, while improving cash and liquidity management for the FHLBNY. For further details, kindly refer to the Bulletin.
The Symmetrical Prepayment Advance Feature
For those anticipating term funding needs, and with rates on an uptrend, it can be an appropriate juncture to consider our SPA feature. This feature allows the member to capture, at prepayment, changes in the fair value of the advance which are favorable to the member. Contact Member Services Desk to discuss.
Looking for more information on the above topics? We’d love to speak with you!
Questions?
If you wish to receive the MSD Weekly Market Update in .pdf format (includes FHLBNY rate charts) or to discuss this content further, please email the MSD Team.