Member Services Desk
Weekly Market Update
This MSD Weekly Market Update reflects information for the week ending July 26, 2024.
Economist Views
Click to expand the below image.
The Federal Open Market Committee (FOMC) meeting is the key event of the upcoming week. Policymakers are almost universally expected to leave the fed funds rate target range unaltered at 5¼% to 5½%. The post-meeting communiqué likely will reiterate that economic activity has continued to expand at a solid pace, job gains have remained strong, and the unemployment rate is low. The statement likely will repeat that inflation has eased over the past year but remains elevated while acknowledging modest further progress in recent months toward the 2% objective. In a major change from the June 11-12 meeting, the upcoming statement may indicate that policymakers have gained greater confidence that inflation is moving sustainably toward target and that it may soon be appropriate to adjust monetary policy to a more accommodative stance. In considering any future adjustments to the rate target range, the FOMC will continue to monitor the implications of incoming data and will probably continue to reduce its holdings of UST and agency debt, and agency MBS at the pace set out at the April meeting, with monthly redemption caps unaltered at $25bn for UST and $35bn for agency and agency MBS.
S&P CoreLogic Case-Shiller 20-City Home Price Index: Home price increases probably slowed marginally across the twenty major metropolitan areas canvassed by SPCLCS in May, rising by .33% after a .38% uptick in April. That projection, if realized, would place the SPCLCS barometer 6.5% above the level posted 12 months earlier.
JOLTS Job Openings: A reported modest increase in online help-wanted postings suggests that job openings rose by 25K to a three-month high of 8.17mn in June. At an estimated 1.36 mn, the excess of vacant positions nationwide would represent 1.2 jobs per unemployed person.
Conference Board Consumer Confidence: The sentiment gauge probably edged .6 point higher to 101 in July, reversing two-thirds of the modest dip witnessed in June.
Pending Home Sales: The number of homes going to contract probably rebounded slightly in June, climbing by 1.5% after a 9.6% dive over the April-May span.
Employment Cost Index: Capped by an anticipated slowdown in wage growth, this broad index probably climbed by 0.8% over the three months ended June, after a 1.2% winter-quarter rise.
Construction Spending: Buoyed by unusually favorable weather conditions, the nominal value of new construction put-in-place likely climbed by .5% in June, erasing the modest .1% prior-month dip.
ISM Manufacturing Activity Report: Available canvasses suggest that the activity gauge remained in contractionary territory in July, shedding one-half point to a five-month low of 48.
Motor Vehicle Sales: To be released August 1 – Vastly increased inventory levels, combined with a modest improvement in consumer confidence, probably propelled light truck and passenger car sales 5.3% higher to a seasonally adjusted annual rate of 16.1mn in July – the strongest tally since the 17mn vehicles purchased in May 2021.
Employment Situation Report: Adversely impacted by Hurricane Beryl during the establishment survey period, nonfarm payrolls likely expanded by just 130K last month, after a 206K gain in June and a 218K rise in May. While the state-insured jobless measure edged higher since the June canvassing period, the national unemployment rate after rounding probably remained unchanged at 4.1%. The failure of the July reporting period to include the 15th of the month suggests that average hourly earnings will disappoint vis-a-vis the .3% median Street estimate.
Federal Reserve Appearances:
July 31 Federal Open Market Committee meeting communique; Federal Reserve Chair Jerome Powell to hold post-FOMC-meeting press conference.
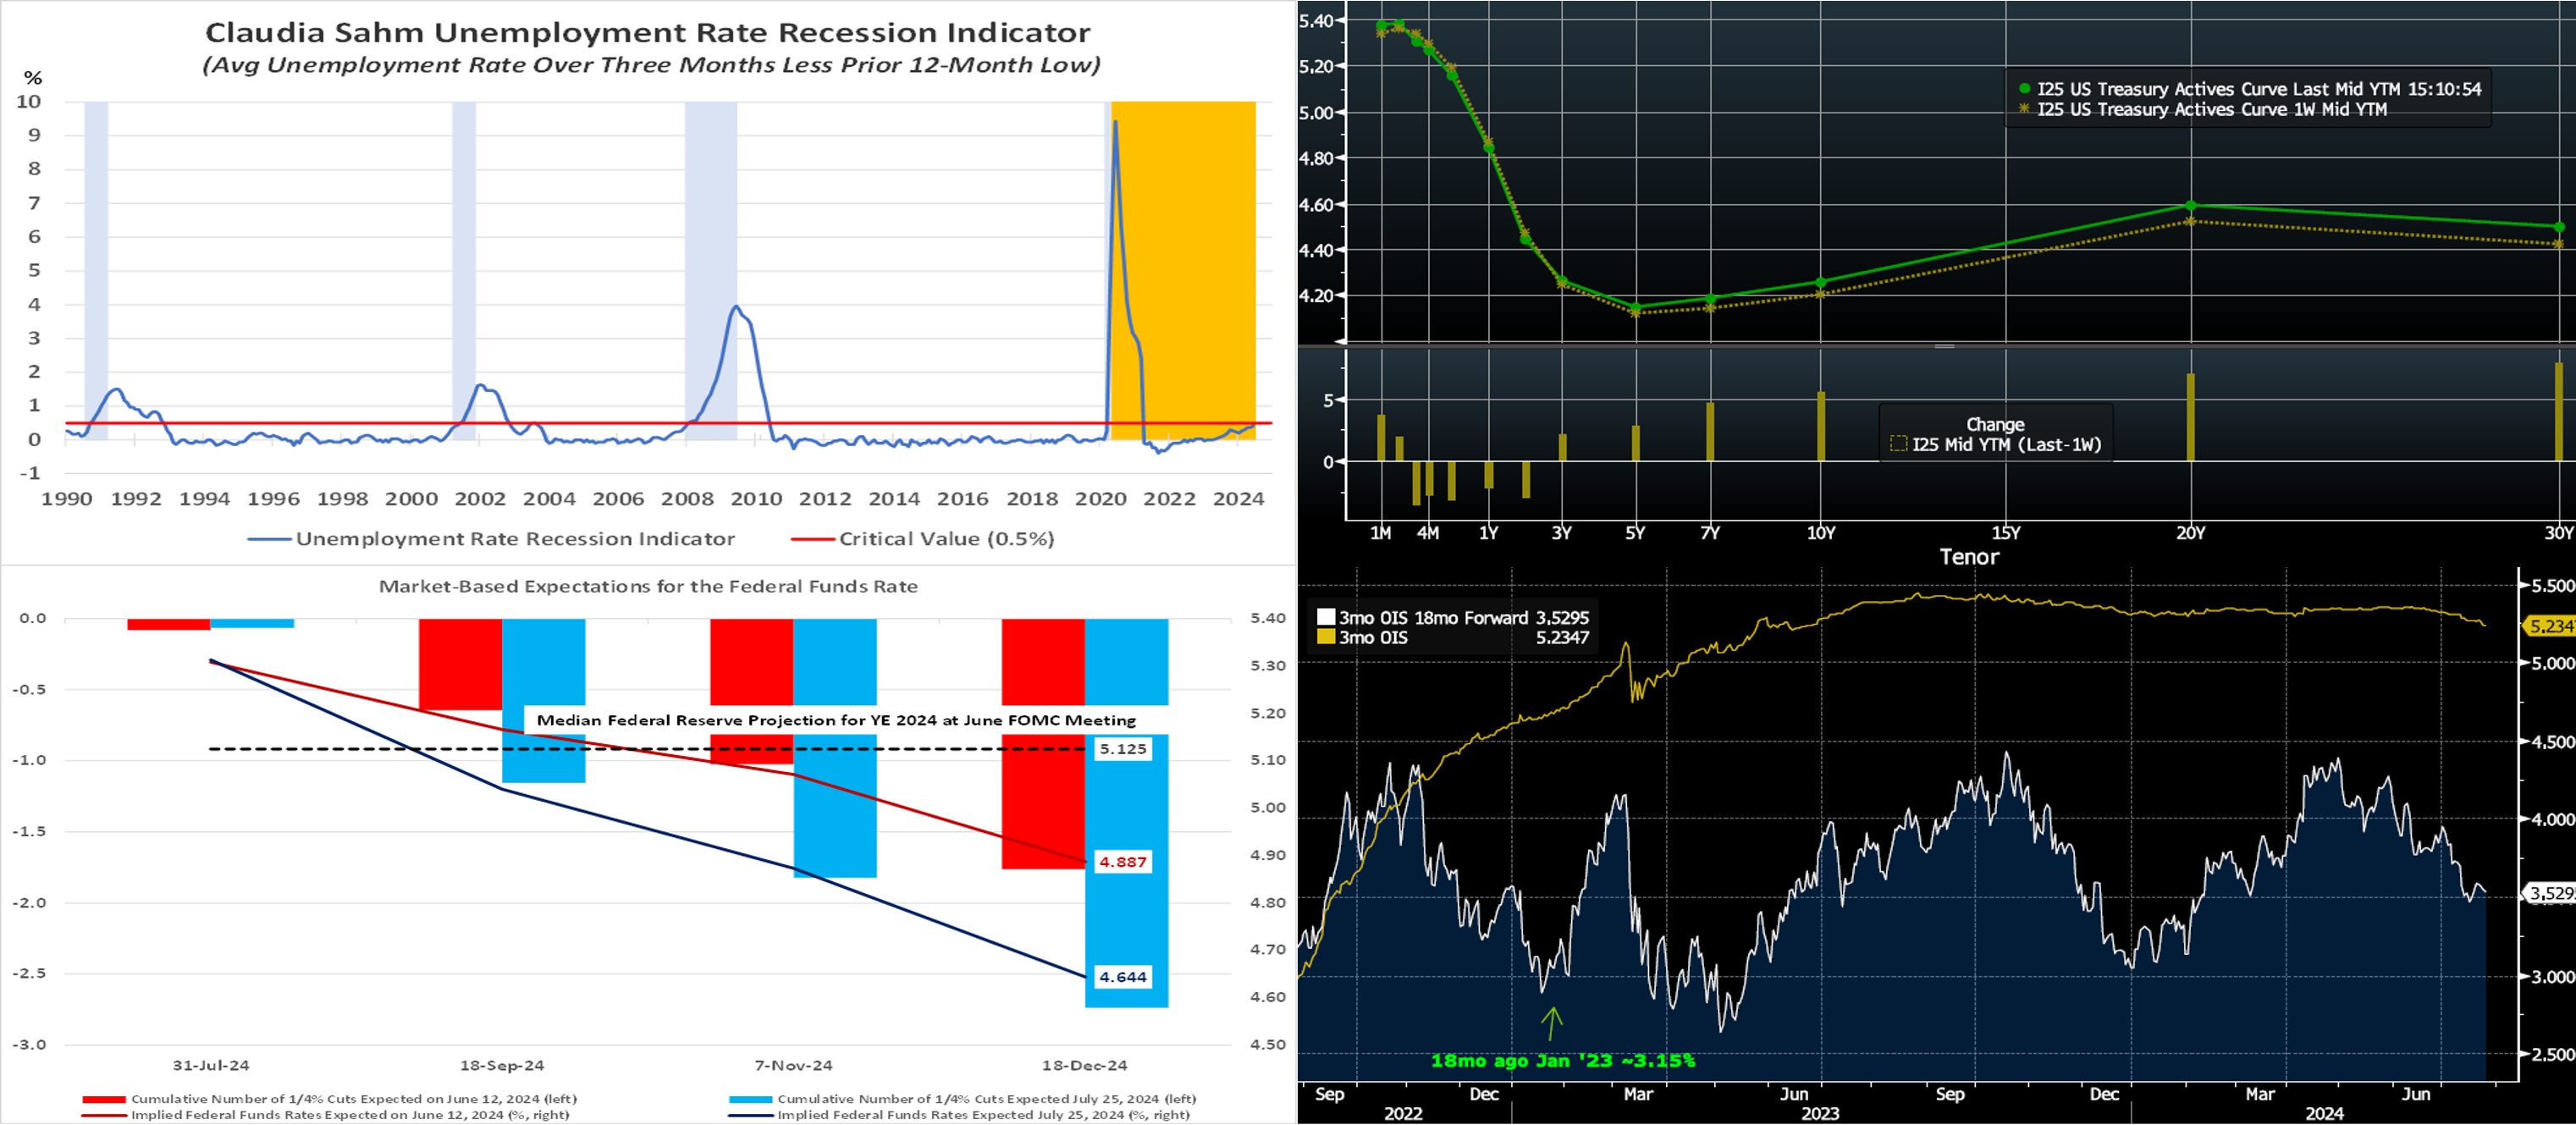
CHART 1 UPPER LEFT
Source: Bureau of Labor Statistics; Federal Reserve St. Louis; National Bureau Economic Research; FHLB-NY. Notes: Blue-shaded areas denote recession; orange-shaded area highlights current economic expansion. The BLS’ household survey from which the civilian unemployment rate is calculated probably will receive heightened scrutiny in the upcoming report. Economist Claudia Sahm has determined that a recession starts when the three-month moving average of the national unemployment rate rises by .5 percentage point (ppt) or more relative to the minimum of the three-month averages over the prior twelve months. This barometer has been moving gradually higher since the beginning of this year and, as of June, stood just .07 ppt below the critical value consistent with the start of a business-cycle contraction. An uptick in the unemployment rate to 4.2% in July would trigger a recession signal using this metric. In essence, it could provide clarity on the prospect of forthcoming Fed rate cuts.
CHART 2 UPPER RIGHT
Source: Bloomberg. Top pane is yield (LHS, %), bottom pane is change (LHS, bps). As of Thursday afternoon, the UST term curve steepened from the week prior, with the 2-year unchanged (adjusted for the roll to a new on-the-run bond) and the rest of the curve 2 to 7 bps higher in progressive fashion. Given the Fed’s self-imposed blackout before the upcoming FOMC, Fedspeak was absent. Economic data was generally comforting soft-landing-wise, with a strong initial estimate for Q2 GDP that also portrayed evidence of disinflation. In terms of market-implied pricing of the Fed, please refer to the subsequent chart and color. Clearly, the market’s focus will square on the FOMC meeting and jobs report in the week ahead.
CHART 3 LOWER LEFT
Source: Bloomberg; Board of Governors of Federal Reserve; FHLB-NY. Market expectations of prospective Fed rate cuts this year, which were already ahead of policymakers’ median projection at the time of the June FOMC meeting, have become more aggressive since then due to cooling inflation and labor-market readings. As of midday Thursday, the market priced with certainty the first 25 bps cut at the September 17-18 FOMC, with about 10% chance of an even-larger 50 bps cut. In contrast to the single 25 bps ease in the target range to 5% to 5¼% for year-end (dashed horizontal line) contained in the Fed’s June “dot plot,” market participants now price for the equivalent of almost three which would thereby pare the Fed funds rate to ~4.644%.
CHART 4 LOWER RIGHT
Source: Bloomberg. Here we revisit the “near-term forward spread,” a measure of the current 3-month rate (Gold, RHS, %) vs. the expected 3-month rate 18-month forward (White, RHS, %) implied in the market yield curve. OIS (Overnight Index Swap, a Fed Funds effective rate-based product) rates are used here. This near-term forward spread has been cited in past Fed research, and by Fed Chair Powell comments, as containing good predictive power for the future stance of monetary policy as well as recessions. In simplest terms, if this curve is inverted (forward below the current rate), then the market is predicting an economic slowdown and Fed-easing cycle. As can be seen, this spread has been inverted for ~22 months! And the market, 18 months ago in January 2023, priced a forward rate in 18 months’ time of ~3.15%. Given that the current 3-month OIS is ~5.24%, this prediction was a bit off! Basically, economic buoyancy and the Fed’s tightening posture has persisted longer than the market’s predictions. But it does appear that the long-awaited Fed-easing cycle is soon and finally close at hand; indeed, the upcoming FOMC should shed light on this front.
FHLBNY Advance Rates Observations
Front-End Rates
- Short-end rates were mixed from a week ago, with 1-month-and-in tenors higher by 2 to 5 bps but 2-month-and-out tenors lower by 1 to 4 bps. The shortest tenors rose in sympathy with technical upward pressures on short-dated repo rates, namely increased UST security settlements and GSE withdrawal of funds near the 24th of the month to pay MBS holders. The longer tenors, meanwhile, dipped on the market pricing of a potential Fed easing timeline. Money Market Fund AUM has increased recently and remains sturdy. Net T-bill issuance is expected to accelerate further in the next month, but the supply/demand dynamic in the short-end remains solid, with FHLB paper continuing to trade tight to T-bills.
- The market’s focus will be on the FOMC meeting and jobs report in the week ahead.
Term Rates
- The longer-term curve, generally mirroring moves in USTs and swaps, was steeper from a week ago. While the 2-year was 2 bps lower, the rest of the curve was 1 to 7 bps higher in progressive fashion. Please refer to the previous section for color on the changes.
- On the UST term supply front, the upcoming week serves a reprieve from auctions. Note that UST auctions usually occur at 1pm and can occasionally spur volatility around that time. Please contact the Member Services Desk for further information on market dynamics, rate levels, or products. Note that our “800 number” is again ready for use at 1-800-546-5101 option 1.
The FHLBNY is pleased to announce the 2024 0% Development Advance (ZDA) Program, now available with a new streamlined submission process. This program provides members with subsidized funding in the form of interest rate credits to assist in originating loans or purchasing loans/investments that meet the eligibility criteria under the Business Development Advance (BDA), Climate Development Advance (CDA), Infrastructure Development Advance (IDA), or Tribal Development Advance (TDA). Please contact the Member Service Desk for information and/or visit our ZDA information page.
Price Incentives for Advances Executed Before Noon: In effect as of Tuesday, September 5, 2023, the FHLBNY is pleased to now offer price incentives for advances executed before Noon each business day. These pricing incentives offer an opportunity to provide economic value to our members, while improving cash and liquidity management for the FHLBNY. For further details, kindly refer to the Bulletin.
The Symmetrical Prepayment Advance Feature
For those anticipating term funding needs, and with rates on an uptrend, it can be an appropriate juncture to consider our SPA feature. This feature allows the member to capture, at prepayment, changes in the fair value of the advance which are favorable to the member. Contact Member Services Desk to discuss.
Looking for more information on the above topics? We’d love to speak with you!
Questions?
If you wish to receive the MSD Weekly Market Update in .pdf format (includes FHLBNY rate charts) or to discuss this content further, please email the MSD Team.