Member Services Desk
Weekly Market Update
This MSD Weekly Market Update reflects information for the week ending July 19, 2024.
Economist Views
Click to expand the below image.
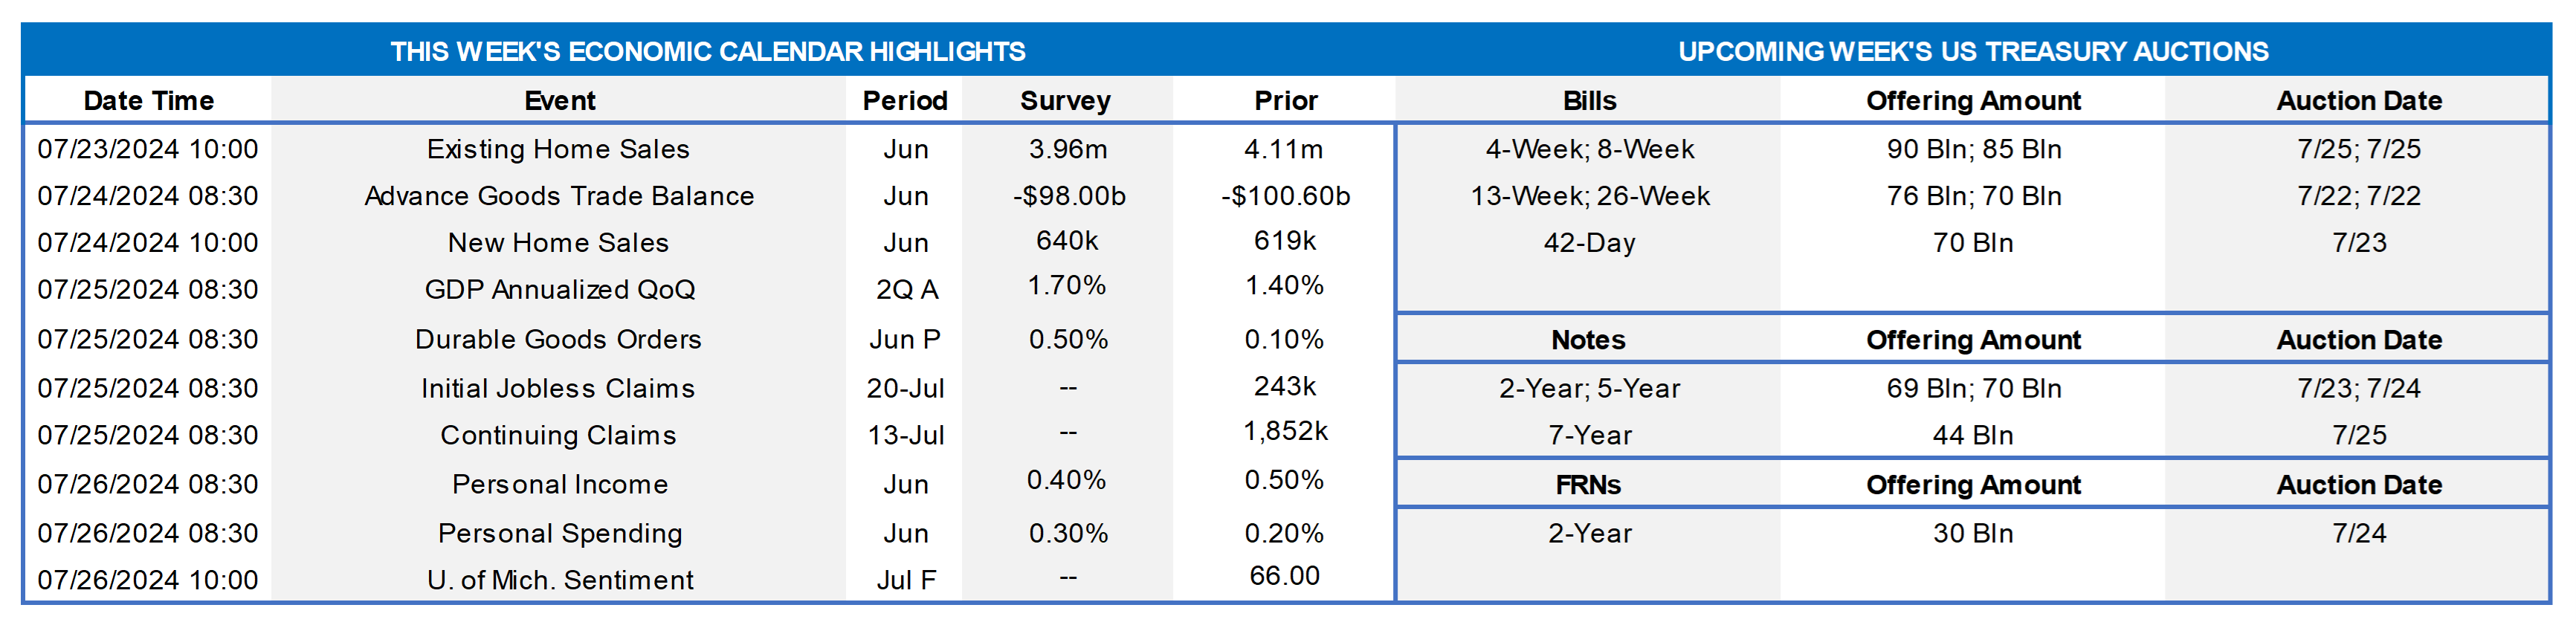
The Bureau of Economic Analysis’ (BEA) advance report on Q2 real GDP growth will undoubtedly be the marquee release of the upcoming week. Inflation-adjusted business activity is expected to have quickened to an above-trend 2% annualized pace during the spring quarter, but as is usually the case with the first look, the range of forecasts is wide. Indeed, data released since that median projection was produced, including upbeat reports on housing starts, industrial production and “control” retail sales in June, hint at an advance result in a 2.5%-3% annualized range. Adding to the positive tone of the BEA’s report, closely followed inflation gauges are expected to have slowed during the reference period. Other reports are likely to be mixed. Both existing and new home purchases probably faltered in June, while durable goods bookings receded for the first time since January. By contrast, both personal income and consumer spending probably moved higher at the end of Q2. All will be quiet on the Federal Reserve front, with officials observing the pre-FOMC meeting blackout period.
Existing Home Sales: A sharp decline in home-purchase contract signings over the April-May span suggests that closings nationwide probably tumbled by 4.1% to a six-month low seasonally adjusted annual rate of 3.94mn in June. With the number of available homes on the market likely to dip by .8% to 1.27mn on a not seasonally adjusted basis during the reference period, the supply at the estimated sales pace would move two ticks higher in 3.9 months.
Merchandise Trade Balance: The deficit on international trade in goods is expected to have retreated to $98bn in June from the $99.4bn shortfall recorded in the prior month.
New Home Sales: Reported declines in single-family building permits and housing starts suggest that contract signings on newly constructed homes fell by 3.6% to a seasonally adjusted annual rate of 597K in June – the weakest performance since the 596K dwellings purchased in November 2022.
Jobless Claims: Initial claims for unemployment insurance benefits probably remained in a 225-235K range during the filing period ended July 19. Keep a close eye on continuing claims, which likely remained above 1.85mn for a fourth straight week during the period ended July 13, for signs that recently furloughed employees are indeed having a more challenging time finding work.
Durable Goods Orders: A tug of war between softer transportation equipment bookings and other requisitions probably left durable goods orders .9% lower in June, following an uninterrupted 2.3% gain over the prior four months.
Personal Income & Spending: Buoyed by anticipated increases in wages and salaries, personal income probably rose by .4% in June, almost matching the .5% gain witnessed in May. Nominal consumer spending likely rose by a similar amount during the reference period, besting the .2% prior-month uptick. Echoing the results of the Bureau of Labor Statistics’ CPI report, inflation soundings in June should be encouraging in the BEA’s report.
Michigan Sentiment Index: Consumer confidence probably recovered during the latter half of July, boosting the University of Michigan’s barometer above the preliminary 66 reading.
Federal Reserve Appearances: Federal Reserve officials will observe the blackout period on public appearances ahead of the July 30-31 FOMC meeting.
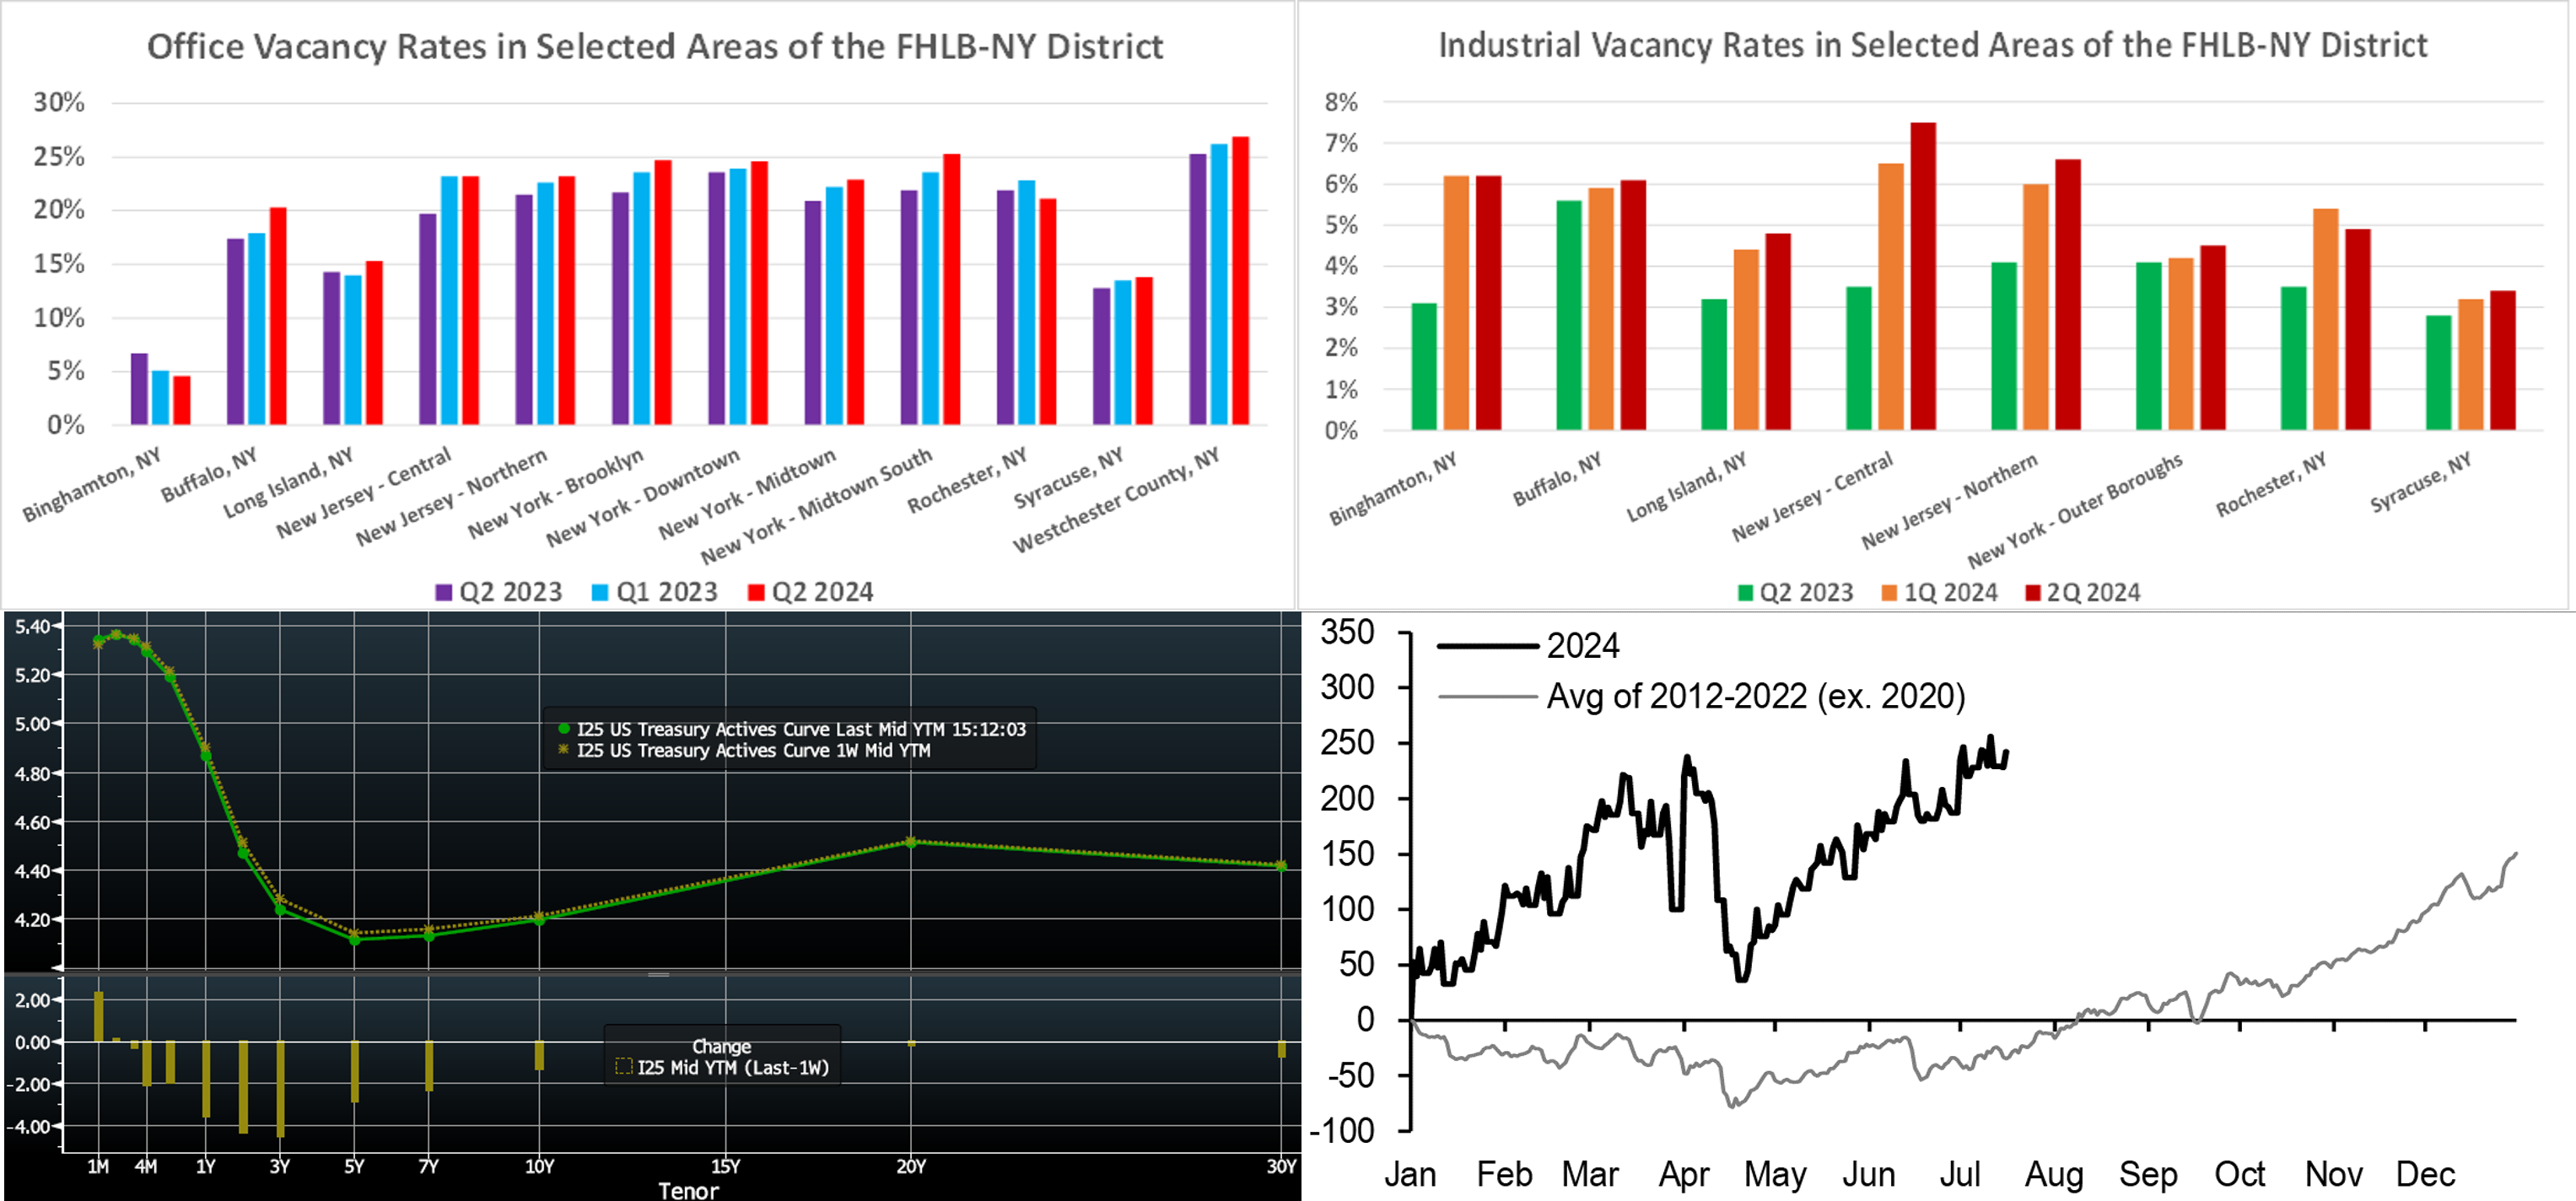
CHART 1 UPPER LEFT and CHART 2 UPPER RIGHT
Source: Cushman & Wakefield; FHLB-NY. Commercial real estate (CRE) conditions remained challenging across the FHLB-NY district during the spring quarter. With very few exceptions, net absorption of square footage of office and industrial space was negative across major metro areas of the Empire and Garden States over the April-June span, with vacancy rates moving higher. Except for Binghamton and Rochester, NY, office vacancy rates (Left-side chart) across the FHLB-NY coverage area were above those witnessed over the winter and prior spring. At a staggering 24.3%, the average office vacancy rate in Manhattan in Q2 was more than double the 10.5% posted before the COVID-19 pandemic struck. Although an area of comparative strength in CRE, demand for industrial space has been cooling, thereby lifting vacancy rates (Right-side chart) for those structures as well.
CHART 3 LOWER LEFT
Source: Bloomberg. Top pane is yield (LHS, %), bottom pane is change (LHS, bps). As of Thursday afternoon, the UST term curve was slightly lower than a week ago, with the 3-year down ~4.5 bps to lead the modest move. The tone of Fedspeak during the week was generally supportive of the soft-landing scenario. For instance, Fed Vice-Chair Williams noted that inflation data and signs of labor market cooling indicate that inflation could be moving sustainably to the 2% goal. In terms of market-implied pricing of the Fed, there is now ~98% cumulative chance of a 25 bps rate cut priced for the September 19th FOMC; the November meeting is at 160%, up a tad from 156% a week ago. The year-end 2024 forward is now ~4.70%, or about 2 bps lower than last week, thereby implying a cumulative total of ~63 bps of cuts by the end of this year. With the Fed in blackout mode before its end-of-month meeting, the market will monitor data for direction.
CHART 4 LOWER RIGHT
Source: Crane Data; iMoneyNet; JP Morgan. Money Market Fund (MMF) assets under management AUM) have continued to increase in the past few months. Shown here is the cumulative year-to-date change in taxable MMF AUM (LHS, $bn) for both this year thus far, at ~$240bn, and the average of years prior to the latest Fed hiking cycle when rates were at much lower levels; in that regard, comparisons over time periods are not straight “apples to apples”. After the tax-date related dip in April, AUM has trudged higher and now resides near all-time highs of $6.4trn. Note that this increase follows the massive ~$1.06trn, or ~22%, rise in AUM in 2023. While time will tell, this trend may persist even through the initial stage of a potentially forthcoming Fed easing cycle, as the yields are still attractive on a relative basis and are above bank deposit rates. AUM levels should maintain further support via investors’ likely re-investment of interest payments as well as Federal deficits’ increase of money supply. Naturally, how this dynamic plays out will be a focus for financial institutions and their deposit strategies and analysis. On a positive note, with the vast majority of MMF AUM in government-only vehicles, the steady demand has benefited FHLB debt issuance and, in turn, advance levels.
FHLBNY Advance Rates Observations
Front-End Rates
- Short-end rates were lower and the front-end curve flatter from a week ago, owing to the market pricing for slightly more aggressive easing in 2024. Money Market Fund AUM has increased recently and remains sturdy. Net T-bill issuance is expected to accelerate further in the next month, but the supply/demand dynamic in the short-end remains solid, and FHLB paper continues to trade tight to T-bills.
- With the Fed in blackout mode, the market’s focus will be on data in the week ahead.
Term Rates
- The longer-term curve, generally mirroring moves in USTs and swaps, was mixed from a week ago. Whereas the 2-year declined 4 bps, other tenors were only modestly changed. Please refer to the previous section for color on the changes.
- On the UST term supply front, the upcoming week serves 2/5/7-year auctions. Note that UST auctions usually occur at 1pm and can occasionally spur volatility around that time. Please contact the Member Service Desk for further information on market dynamics, rate levels, or products. Note that our “800 number” is again ready for use at 1-800-546-5101 option 1.
The FHLBNY is pleased to announce the 2024 0% Development Advance (ZDA) Program, now available with a new streamlined submission process. This program provides members with subsidized funding in the form of interest rate credits to assist in originating loans or purchasing loans/investments that meet the eligibility criteria under the Business Development Advance (BDA), Climate Development Advance (CDA), Infrastructure Development Advance (IDA), or Tribal Development Advance (TDA). Please contact the Member Service Desk for information and/or visit our ZDA information page.
Price Incentives for Advances Executed Before Noon: In effect as of Tuesday, September 5, 2023, the FHLBNY is pleased to now offer price incentives for advances executed before Noon each business day. These pricing incentives offer an opportunity to provide economic value to our members, while improving cash and liquidity management for the FHLBNY. For further details, kindly refer to the Bulletin.
The Symmetrical Prepayment Advance Feature
For those anticipating term funding needs, and with rates on an uptrend, it can be an appropriate juncture to consider our SPA feature. This feature allows the member to capture, at prepayment, changes in the fair value of the advance which are favorable to the member. Contact Member Services Desk to discuss.
Looking for more information on the above topics? We’d love to speak with you!
Questions?
If you wish to receive the MSD Weekly Market Update in .pdf format (includes FHLBNY rate charts) or to discuss this content further, please email the MSD Team.