Member Services Desk
Weekly Market Update
This MSD Weekly Market Update reflects information for the week ending July 12, 2024.
Economist Views
Click to expand the below image.
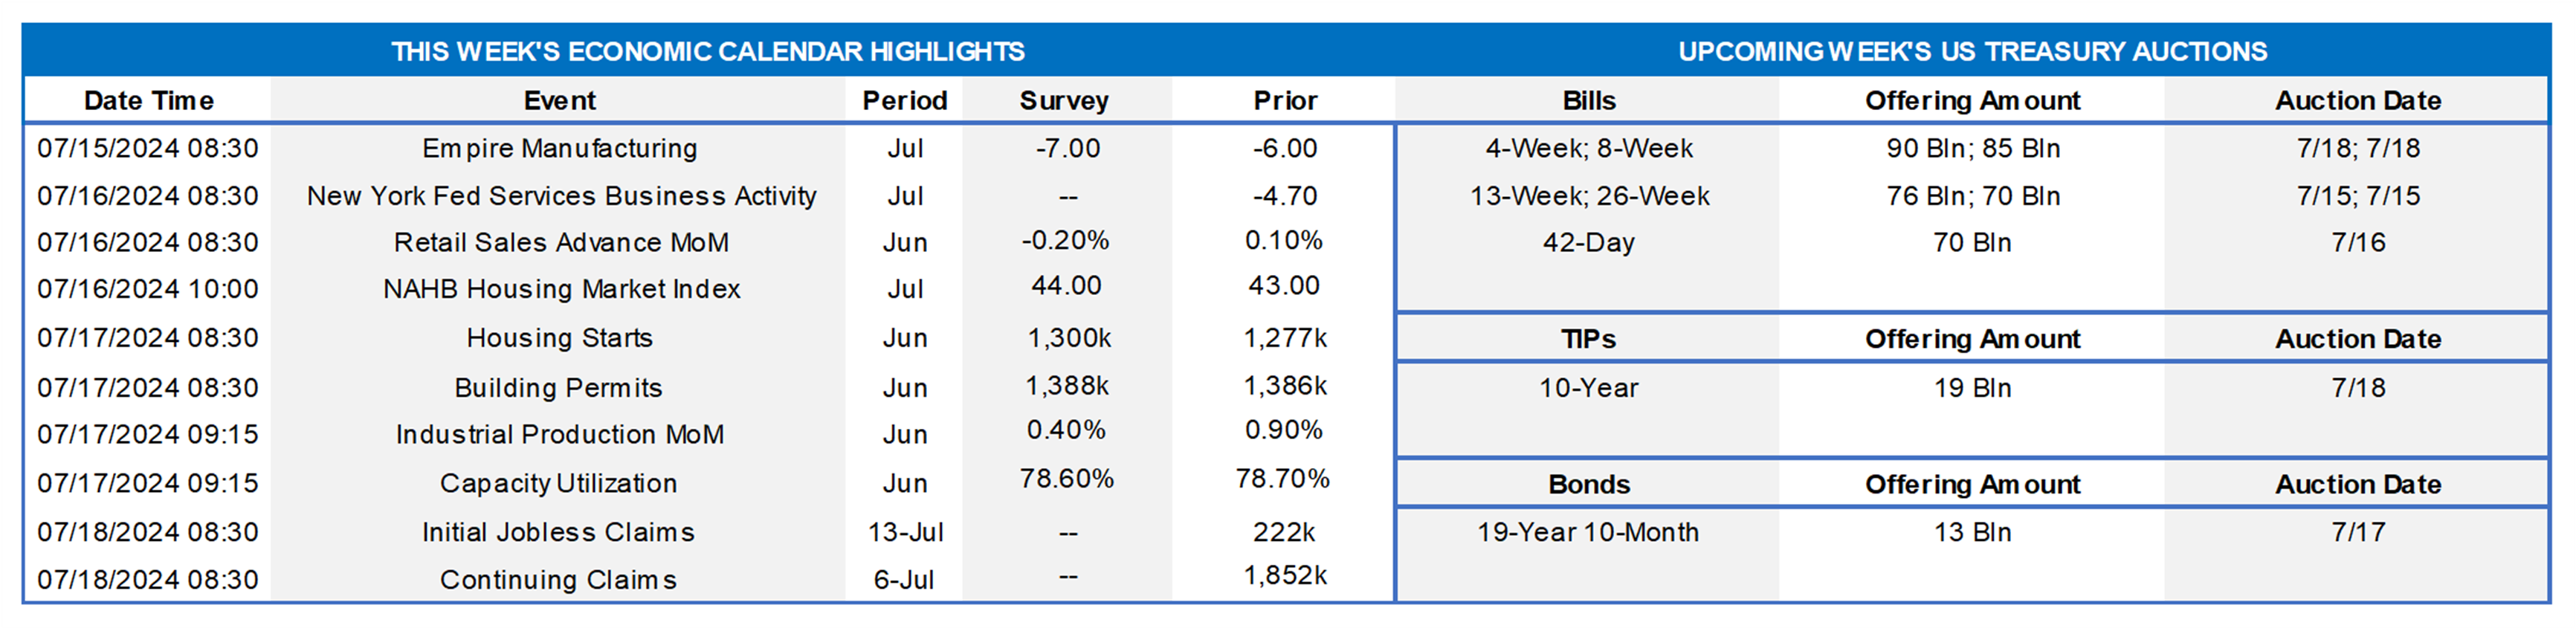
Market participants will confront a crowded calendar of reports and Federal Reserve official appearances before the traditional FOMC blackout period begins next Saturday. Soundings on retail sales, housing starts, and industrial production will help freshen projections for Q2 real GDP growth. The consensus is currently centered around an annualized clip of 2%, up from the below-trend 1.4% pace set during Q1. The upcoming jobless claims report will assist in finalizing forecasts for the July employment report. Data currently in hand point to a slower pace of net hiring in June, but the potential adverse impact of Hurricane Beryl making landfall during the Bureau of Labor Statistics’ canvassing period suggest that the risks lie to the downside. Local economic activity probably remained subdued in early July. An octet of Federal Reserve officials, virtually all of whom are current FOMC voters, will provide their thoughts on a variety of topics.
Empire State Manufacturing Survey: Activity likely contracted for an eighth straight month, although the pace of decline probably slowed from that witnessed in June. The general business conditions diffusion index – the net percentage of survey respondents noting a pickup in activity less those experiencing a decline – is expected to improve from the -6% reading posted in the prior month.
New York Fed Service-Producing Survey: Service-producing activity across NY, northern NJ, and western CT probably was little changed in early July, following the modest dip recorded in June.
Retail and Food Services Sales: Pared by an anticipated dip in autos, sales likely declined by .3% in June, erasing the modest .1% uptick posted in May. Excluding a projected 2% drop in autos, purchases likely edged .1% higher, reversing the prior month’s decline. Monitor so-called “control” sales excluding auto, building materials, and gas for clues to the pace of spring-quarter consumer spending. Barring any prior-month revisions, a .2% rise would leave core purchases over the Q2 span 1.2% annualized above their Q1 average, following a 1.4% annualized Q1 gain.
NAHB Housing Market Index: Homebuilder sentiment is expected to remain at the year-to-date low of 43 recorded in June. Note the regional data in the National Association of Home Builders’ report. Perhaps because they are having more success completing units under construction than their counterparts elsewhere, builder confidence in the Northeast was extremely high at 62 in June.
Housing Starts & Building Permits: A combination of near-record temperatures and below-normal precipitation suggests that both likely will surprise to the upside in the Census Bureau’s June report.
Industrial Production & Capacity Utilization: Stepped-up factory output, combined with a weather-related increase in utilities generation, likely propelled this measure .7% higher last month, matching the reported May gain. With output increases expected to eclipse additions to capacity, the capacity utilization rate probably moved one-half percentage point higher to 78.7%.
Jobless Claims: Initial claims for unemployment insurance benefits probably returned to a 225-235K range during the filing period ended July 13. Keep a close eye on continuing claims, which likely remained above 1.85mn for a third straight week during the period ended July 6, for signs that recently furloughed employees are indeed having a more challenging time finding work.
Federal Reserve Appearances:
- July 15 Fed Chair Jerome Powell to be interviewed by David Rubenstein at the Economic Club of Washington DC.
- July 16 Federal Reserve Board Governor Adriana Kugler to give closing remarks at the NABE conference in Washington.
- July 17 Federal Reserve to release Beige Book commentary on regional economic conditions.
- July 18 Dallas Fed President Lorie Logan to give opening remarks at a conference co-hosted by the Dallas and Atlanta Feds.
- July 19 New York Fed President John Williams to participates in a panel session on “A New Era for Monetary Policy.”
- July 19 Atlanta Fed President Bostic to give closing remarks at a conference co-hosted by the Dallas and Atlanta Feds.
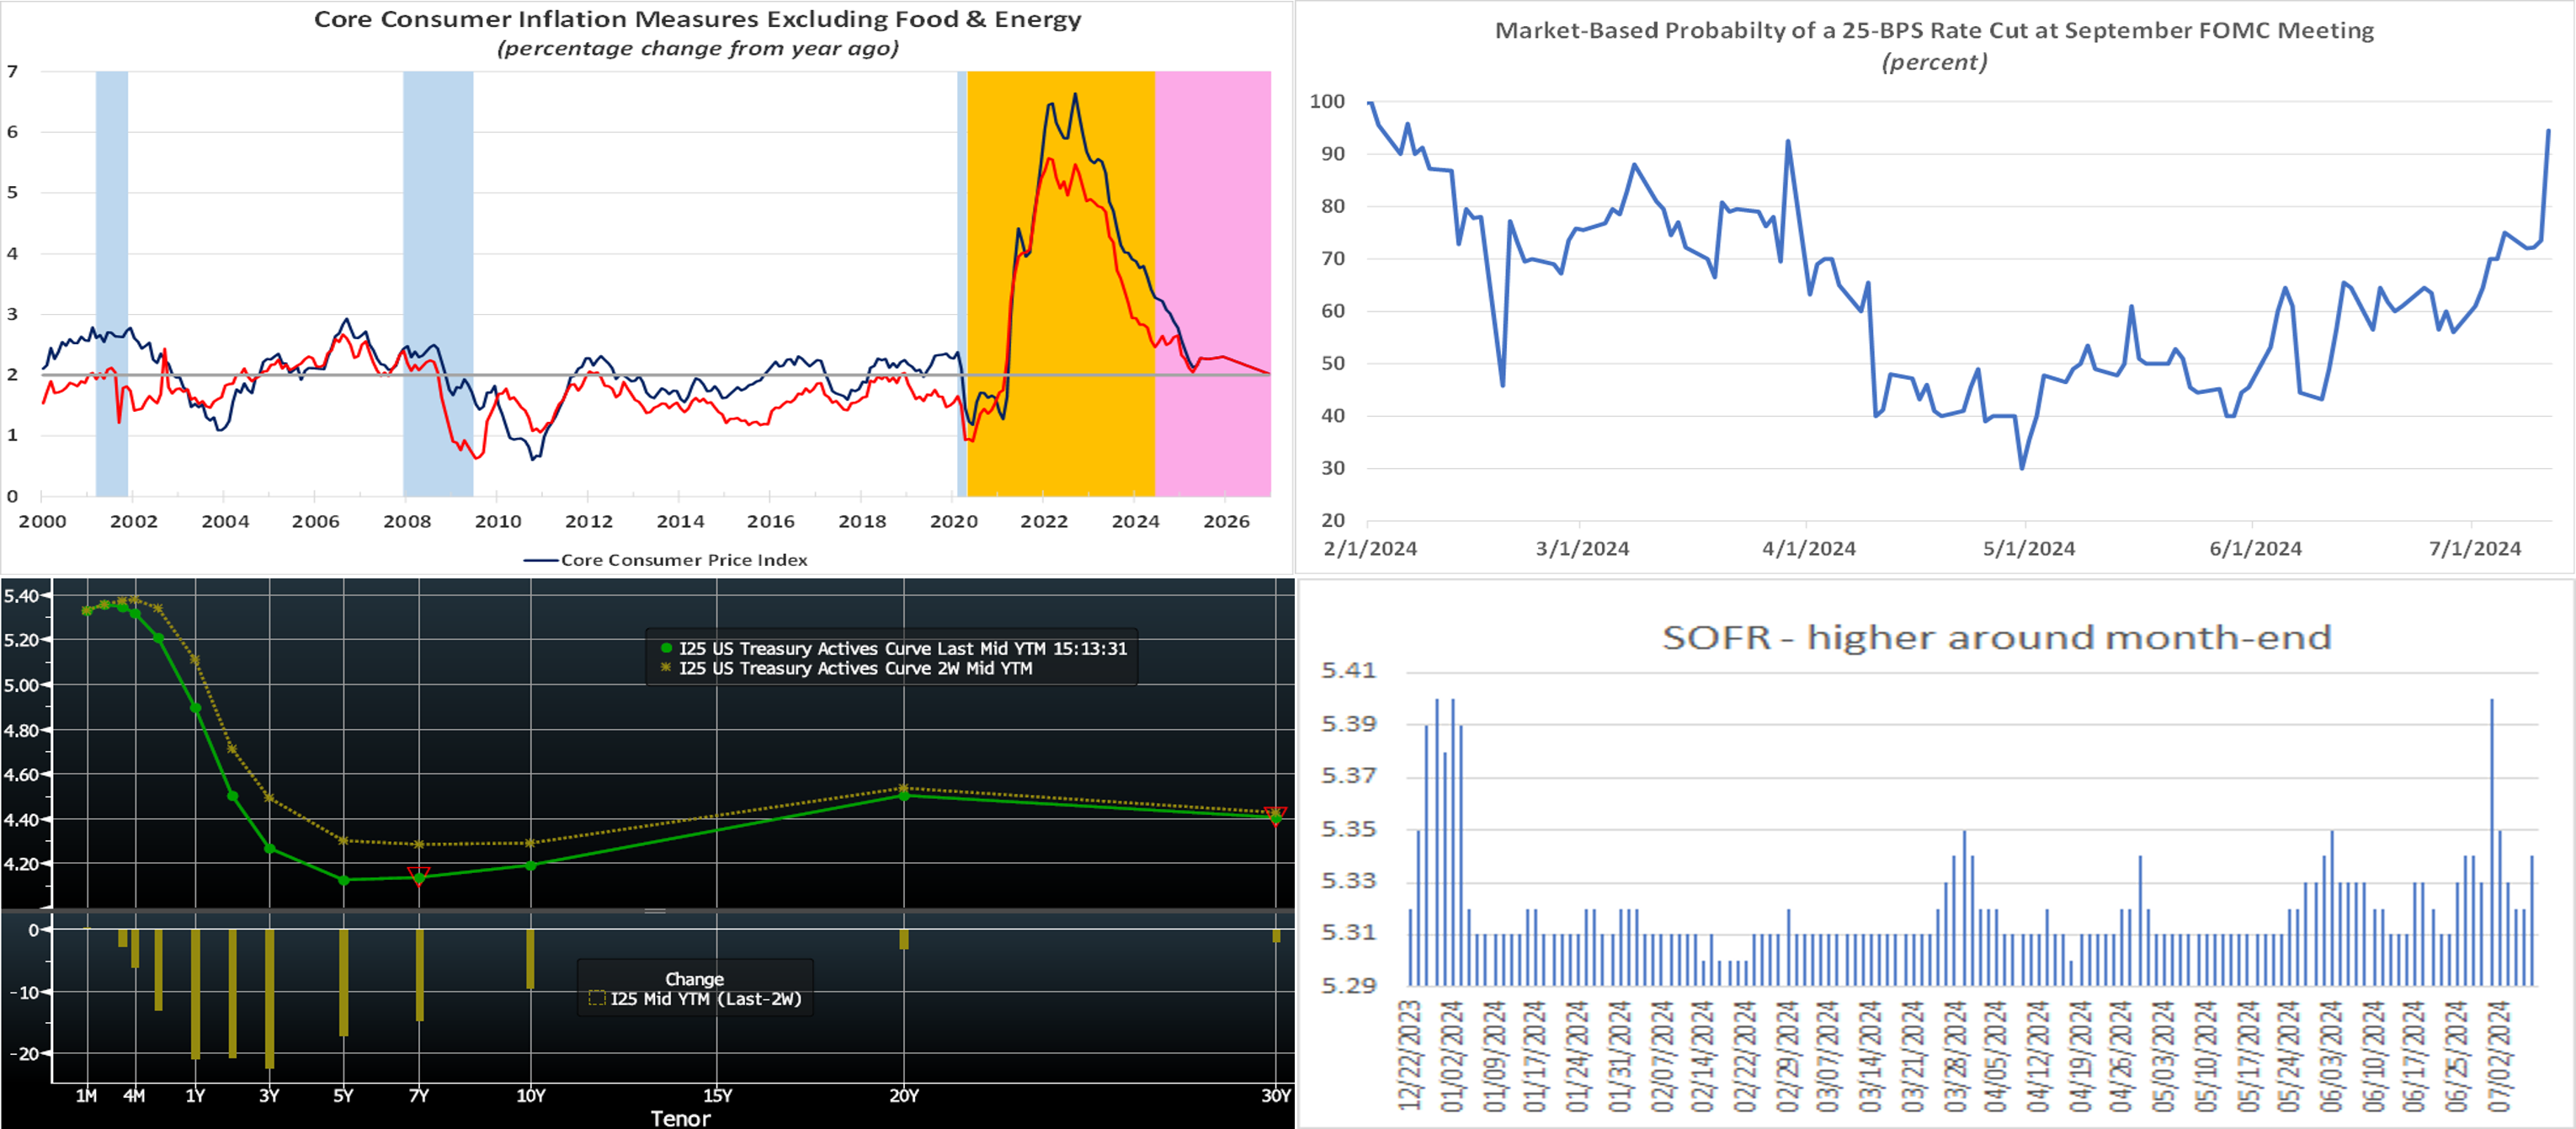
CHART 1 UPPER LEFT
Source: BLS; Bureau of Economic Analysis; Federal Reserve; NBER; FHLBNY. Notes: Blue-shaded areas denote recessions; orange-shaded highlights current economic expansion; pink-shaded area contains projections. One would have been hard pressed to produce a better consumer inflation report than this past Thursday’s for the month of June. The headline CPI retreated for the first time in four years, while the core ex-food-and-energy gauge posted its smallest gain, at .1%, since the summer of 2021. Finally, we experienced a meaningful slowdown in shelter costs – the primary obstacle to the Fed returning inflation back to the desired 2% target. Further improvements could be seen in the months ahead, although the year-to-year growth rates of the overall and core CPI gauges are expected to remain above the Fed’s desired 2% target through 2025. Adding to the optimism on inflation, labor market conditions are softening in July. The upcoming jobs report will be released after the end-of-month FOMC, and so an initial rate ease in mid-September seems the most likely date for the first Fed move.
CHART 2 UPPER RIGHT
Source: Bloomberg; FHLB-NY. The cumulative probability of a September 25-bps cut spiked from 74% the day prior to ~95% immediately after the CPI report. At the time of this writing Thursday afternoon, the odds were nearing 97% and approaching the highest level since early-2024. While these odds have clearly wavered over the course of time and with each data release, the general trend since May has been upward, as data has come in a bit softer-than-expected on both inflation and employment, thereby improving the conditions the Fed needs to move toward easing policy.
CHART 3 LOWER LEFT
Source: Bloomberg. Top pane is yield (LHS, %), bottom pane is change (LHS, bps). As of Thursday afternoon, the UST term curve was lower, led by the 1- to 5-year sector, from our last edition of two weeks ago. The bulk of the move was precipitated by the comforting, inflation-wise, reports on both the employment situation on July 5th and the above-mentioned inflation print. Moreover, Fed Chair Powell commented mid-week in Congressional testimony that inflation trends were reflecting modest progress. These developments sparked fixed income demand and a repricing lower of Fed Funds expectations. In terms of market-implied pricing of the Fed, there is now ~97% cumulative chance of a 25 bps rate cut priced for the September 19th FOMC; the November meeting is at 156%, up from 103% two weeks ago. The year-end 2024 forward is now ~4.72%, compared to 4.89% two weeks ago, thereby implying a cumulative total of ~60 bps of cuts by the end of this year.
CHART 4 LOWER RIGHT
Source: FRB NY; FHLB-NY. Shown here is the recent history of the Secured Overnight Financing Rate (SOFR, LHS %). In the past year, the tendency for the rate to pop upwards near month-end and in the days thereafter has become more discernible. This dynamic is especially the case for quarter-ends, much like the Q2 period that just passed, and is partly a result of dealers’ desire to reduce balance sheet exposures but also mainly a result of large UST principal amount settlements in these time periods. Since SOFR is a barometer for rates in the very short-end of the curve, it can directly impact our Advance rates, most particularly the Overnight tenor. Given this dynamic, members might wish to consider slightly longer tenors, such as 2 or 3-week, in and around month-end periods, if those rates are a bit lower. This strategy would be sensible if it is known with high certainty that at least a minimum dollar amount will need to be borrowed throughout the period.
FHLBNY Advance Rates Observations
Front-End Rates
- Short-end rates were unchanged to a bp higher in the shortest tenors but 3 to 7 bps lower in the 4- to 6-month zone. The dip in the longer maturities mostly occurred after this week’s softer-than-expected CPI report and subsequent pricing lower of Fed expectations. Money Market Fund AUM has increased recently and remains sturdy. Net T-bill issuance is expected to pick up in the next month, but the supply/demand dynamic in the short-end remains solid, and FHLB paper continues to trade tight to T-bills.
- The market’s focus will be on data and Fed speakers in the week ahead.
Term Rates
- The longer-term curve, generally mirroring moves in USTs and swaps, was notably lower from two weeks ago. The 2 and 3-year tenors were ~24 bps lower, with the 5 and 10-year down 19 and 11 bps, respectively. We continue to witness opportunistic interest in putable advances upon rate dips, and we encourage members to contact us for levels and market guidance. Please refer to the previous slide for market color on the market dynamics and changes.
- On the UST term supply front, the upcoming week serves a 10-year TIPS and a 20-year nominal auction. Note that UST auctions usually occur at 1pm and can occasionally spur volatility around that time. Please contact the Member Service Desk for further information on market dynamics, rate levels, or products.
The FHLBNY is pleased to announce the 2024 0% Development Advance (ZDA) Program, now available with a new streamlined submission process. This program provides members with subsidized funding in the form of interest rate credits to assist in originating loans or purchasing loans/investments that meet the eligibility criteria under the Business Development Advance (BDA), Climate Development Advance (CDA), Infrastructure Development Advance (IDA), or Tribal Development Advance (TDA). Please contact the Member Service Desk for information and/or visit our ZDA information page.
Price Incentives for Advances Executed Before Noon: In effect as of Tuesday, September 5, 2023, the FHLBNY is pleased to now offer price incentives for advances executed before Noon each business day. These pricing incentives offer an opportunity to provide economic value to our members, while improving cash and liquidity management for the FHLBNY. For further details, kindly refer to the Bulletin.
The Symmetrical Prepayment Advance Feature
For those anticipating term funding needs, and with rates on an uptrend, it can be an appropriate juncture to consider our SPA feature. This feature allows the member to capture, at prepayment, changes in the fair value of the advance which are favorable to the member. Contact Member Services Desk to discuss.
Looking for more information on the above topics? We’d love to speak with you!
Questions?
If you wish to receive the MSD Weekly Market Update in .pdf format (includes FHLBNY rate charts) or to discuss this content further, please email the MSD Team.