Member Services Desk
Weekly Market Update
This MSD Weekly Market Update reflects information for the week of July 12, 2021.
Economist Views
Click to expand the below image.
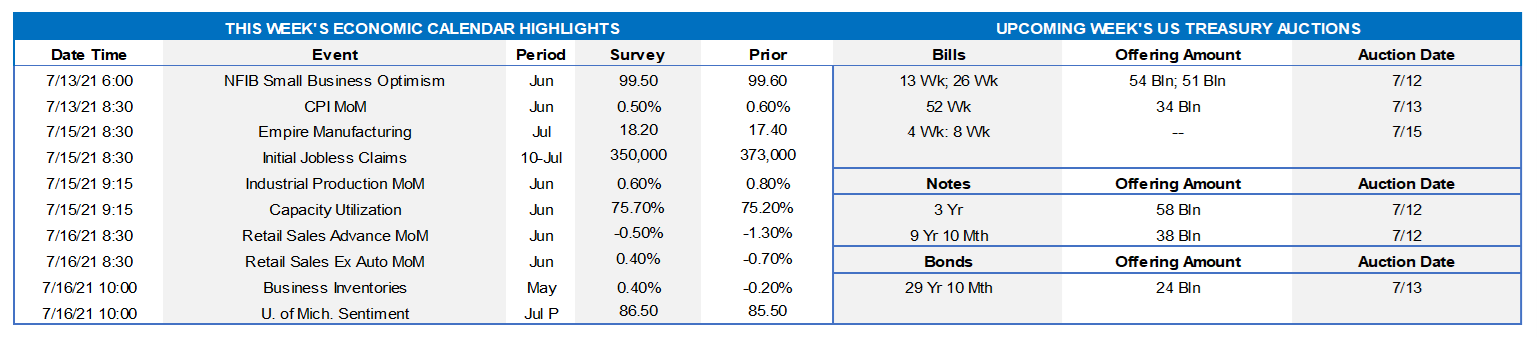
Market participants will contend with a busy data calendar and an extensive slate of appearances by Fed officials this week. Supporting policymakers’ views that the recent pickup in inflation will prove temporary, both overall and core CPI gauges likely slowed last month. Despite an anticipated deceleration in factory output, industrial production probably climbed for a fourth straight month in June. Closer to home, the expansion in NYS manufacturing activity likely entered its second year in July. The already reported decline in unit motor vehicle purchases points to a decline in retail and food services revenues last month, but control sales probably rebounded and reversed all but a fraction of May’s .7% decline. Tracking estimates for Q2 real GDP growth are centered at 8.5% annualized, after the winter’s 6.4% gain. While half a dozen Fed officials are scheduled to speak on a variety of topics, the marquee event of the week will be Chair Powell’s delivery of the Semi-Annual Monetary Policy Report to the Senate Banking Committee.
NFIB Small Business Optimism Index: Recent labor market data suggest that this sentiment gauge moved back above 100 for the first time since November from the 99.6 reading posted in May.
Consumer Price Index: Reflecting a projected deceleration in core goods and services costs, CPI likely climbed by .5% in June, following a .6% increase in May. Excluding anticipated movements in retail food and energy costs, the so-called core CPI likely rose by .4% during the reference period, after a .7% prior-month jump. The median Street projections, if realized, would place the overall and core CPIs 4.9% and 4.0% above their respective year-ago levels.
Empire State Manufacturing Survey: NYS manufacturing activity probably expanded for a 13th consecutive month in July, with the rate of growth likely quickening from June’s figure. The diffusion index – the gap between the percentage of firms experiencing an improvement in activity less than those witnessing a decline – likely widened to 19% from 17.4% in the previous month.
Jobless Claims: Initial and continuing claims under regular state programs likely dipped during the latest reporting periods, however, figures continue to overstate the actual healing of the labor market. Indeed, as of June 19, an estimated 14.2mn persons were receiving some sort of unemployment assistance, down from the pandemic peak of 32.4mn reached a year ago but still well above the 2.1mn prevailing before the COVID-19 crisis. Using June’s level as a base, 8.8% of the civilian labor force were receiving some form of unemployment insurance payments two weeks ago.
Industrial Production & Capacity Utilization: Capped by an anticipated slowdown in nationwide factory activity, this barometer probably rose by .6% in June, after a .8% gain in May. With output likely eclipsing additions to productive capacity by a significant margin during the reference period, the overall operating rate probably climbed by 0.4 percentage point to 75.6% – the highest reading since the pandemic prompted the closing of the economy in March 2020.
Retail & Food Services Sales: This update will provide valuable information on consumer spending growth at the end of the spring quarter. Pared by a reported pullback in motor vehicle purchases, retail and food services sales likely dipped by .6% last month, after a 1.3% drop in May. Data-watchers will pay close attention to so-called control sales excluding auto, building materials and gasoline purchases. Barring any prior-month revisions, the .6% rise anticipated by the Street would place core purchases over the April-June period a solid 15% annualized above their Q1 average.
University of Michigan Sentiment Index: Weekly readings suggest that the consumer confidence gauge remained on a saw-toothed pattern in early July, retreating to a five-month low of 82.5%.
Federal Reserve Appearances:
- July 14: Federal Reserve Board to release Beige Book Summary of Current Economic Conditions.
- July 14: The House Financial Services Committee will hold a hearing on monetary policy and the state of the economy.
- July 15: Federal Reserve Chair Powell to deliver Semi-Annual Monetary Policy Report to the Senate Banking Committee.
Click to expand the below images.
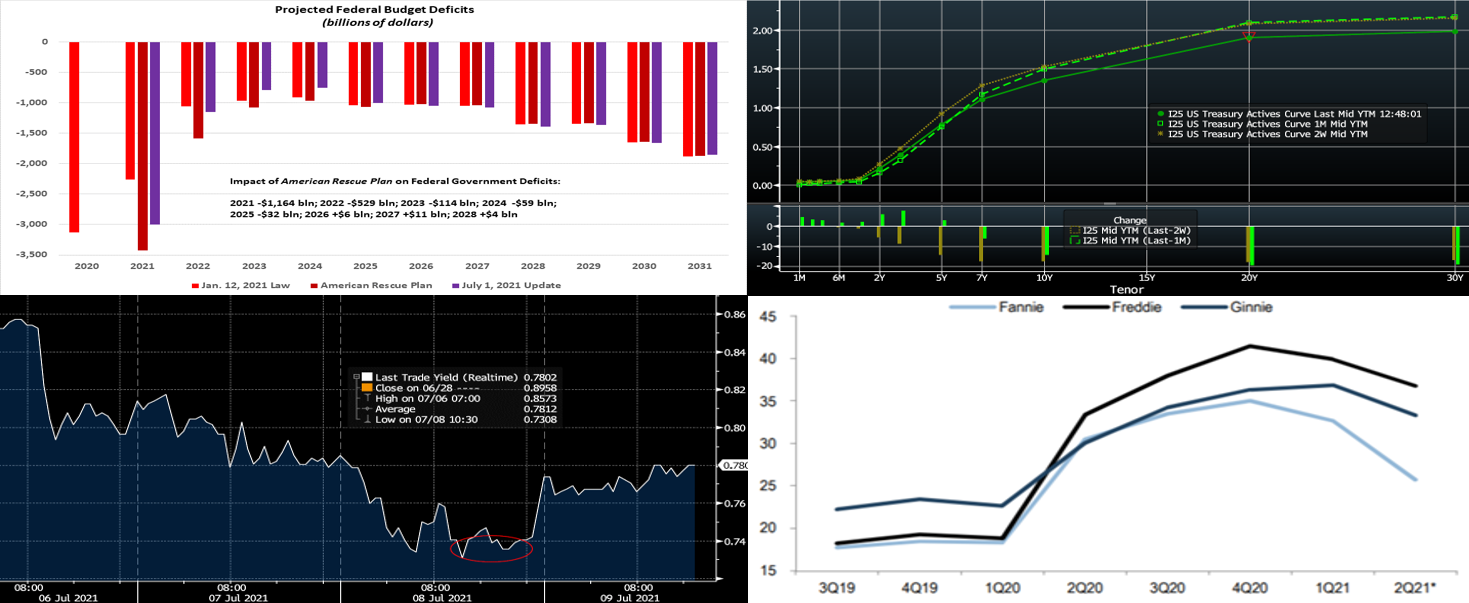
CHART 1 UPPER LEFT
Source: CBO; FHLBNY. The CBO’s updated budget projections foresee a 2021 fiscal-year deficit of $3trn, nearly $130bn less than the shortfall recorded in 2020 but triple that recorded in 2019. Relative to the size of the economy, the 2021 deficit is projected to total 13.4% of nominal GDP, making it the second largest since 1945 and exceeded only by the 14.9% gap of last year. The economic disruption of the pandemic and the legislation enacted in response continue to weigh on the federal government’s financial position. Baseline deficits under current law are significantly smaller after 2021 and average $1.2trn from 2022 to 2031. They average 4.2% of GDP through 2031, well above their 50-year average of 3.3%. Federal debt held by the public— which stood at $21trn, or 100% of GDP, at the end of 2020—would total $23trn, or 103% of GDP, at the end of 2021. As recently as 2007, at the start of the previous recession, federal debt equaled just 35% of GDP. Projected debt dips just below 100% of GDP between 2023 and 2025 before rising again to 106% in 2031, about the same as the amount recorded in 1946, which stands as the highest in the nation’s history.
CHART 2 UPPER RIGHT
Source: Bloomberg. Note: top pane is yield (%), the bottom pane is change (bps). The curve has moved notably lower and flatter from two weeks ago. As of midday Friday, UST yields were ~4 bps lower in 2-year, ~13 lower in 5-year, and ~16 lower in 10-year, with roughly half of the move occurring post the July 4th holiday. Various forces have contributed to the move. The market appears to be more comfortable with the Fed’s stance on inflation and that upticks will be transitory. Concern over potential impacts from the Covid Delta variant has also risen, especially its impact globally but also domestically too, thereby possibly leading to a more drawn-out economic recovery. Short-covering and “steepener unwinds” have continued from market trading-type participants, and the Fed’s securities purchases are a consistent presence for now. This upcoming week, participants will closely monitor Fed Chair Powell’s Senate appearance for fresh clues on the direction of rates.
CHART 3 LOWER LEFT
Source: Bloomberg. Here is a chart of the UST 5-year yield in 30-minute increments during the past week. While the yield was trading ~.79% late Friday, note that it had reached .73%, close to the bottom end of its past 4-month range, early the day prior. While market timing should be left to “trading types”, members with plans to draw term funding or use CLP availability can monitor the markets in order to potentially secure more advantageous rates. Note that our advance rates move with the market, and so our “Daily Rate Sheet” represents strictly a point in time. Please note that the desk can provide indications and guidance both before the “Daily Rate Sheet” arrives in your mailbox and throughout the day.
CHART 4 LOWER RIGHT
Source: JP Morgan; FHLMC; FNMA; GNMA. Shown here are the quarterly average of monthly 30-year Agency MBS CPR (Conditional Prepayment Rate) aggregate speeds over the past two years (Q2 ‘21 is through May). Speeds have slowed which should benefit banks. Positively, very high residential mortgage prepays began to decline late in Q2 with refinancing slowing, as expected, and should benefit net interest income going forward mainly via lower MBS premium amortization expense but also less “forced” re-investment at lower yields. While mortgage rates have declined in the past few weeks, MBS prepays are likely to struggle to again reach their loftiest levels, as many homeowners have already “refi’d” and/or the recent rates decline may be short-lived.
FHLBNY Advance Rates Observations
Front-End Rates
- Short-end Advance rates finished unchanged to 1 bps lower from two weeks ago. Money Market Funds’ AUM declined further by ~$17bn this past week, somewhat sapping demand for paper, albeit some of that decline appears to be funds going directly to the RRP post the Fed’s rate adjustment of a few weeks ago. The overall supply/demand paradigm persists, however, as the GSEs continue to invest larger sums into money markets, the TGA continues its decline, and short-maturity paper is in short supply. In a more recent development, state and local governments are receiving federal disbursements from the most recent relief bill and are parking funds in short-term investment “placeholders”. For any members experiencing such municipal deposit inflows, consider our Refundable Municipal Letter of Credit product; please call Member Services Desk to discuss.
- UST issuance overall is now net positive supply in that more is being issued than what the Fed is buying in its programs. However, with short UST rates at rock-bottom levels and the Fed on hold for a long period, rates are likely to persist in a near-term sideways pattern. Importantly, weekly net T-bill issuance has been lower since 2020 and negative in recent months, and Treasury intends to shift issuance out the curve. Further legislative packages and related borrowing may lead to an eventual increase of T-bill auction sizes and positive net supply, but for now overall market supply/demand dynamics should keep short rates in check from large moves to the upside.
Term Rates
- Advance rates “bull flattened” from two weeks prior. While the 3-year-and-in sector was 3 to 7 bps lower, the 4 to 10-year sector was 9 to 18 bps lower, in progressive fashion. Kindly refer to the previous section for further color on relevant market dynamics.
- On the UST supply front, this week brings 3/10/30-year auctions. These auctions just over the horizon seemed to play a part in the rates backup of Friday from the day prior. The market will closely watch Fed Chair Powell’s testimony to the Senate Banking Committee this week.
New Product Alert: In order to satisfy member needs and provide greater product flexibility to match bond and derivative market conventions, FHLB-NY now offers SOFR-linked advances based on SOFR-index compounding. Note that this product is in addition to SOFR-linked advances based on SOFR-index averaging which have been offered since November 2018.
The Symmetrical Prepayment Advance Feature
With rates at or near multi-year lows, it is a compelling juncture to use the SPA feature on term advances. This feature allows member to capture, at prepayment, changes in the Fair Value of the advance which are favorable to the member. Contact us to discuss.
Looking for more information on the above topics? We’d love to speak with you!
Questions?
If you wish to receive the MSD Weekly Market Update in .pdf format (includes FHLBNY rate charts) or to discuss this content further, please email the
MSD Team.
Special Member Alert
The FHLBNY recently announced a newly expanded and flexible Disaster Relief Funding (DRF) advance program which offers discounted rate advances with maturities 1-mo and greater. Additionally, we have announced that PPP loans will be accepted as eligible collateral. Please contact us with any questions.