Member Services Desk
Weekly Market Update
This MSD Weekly Market Update reflects information for the week ending June 21, 2024.
Economist Views
Click to expand the below image.
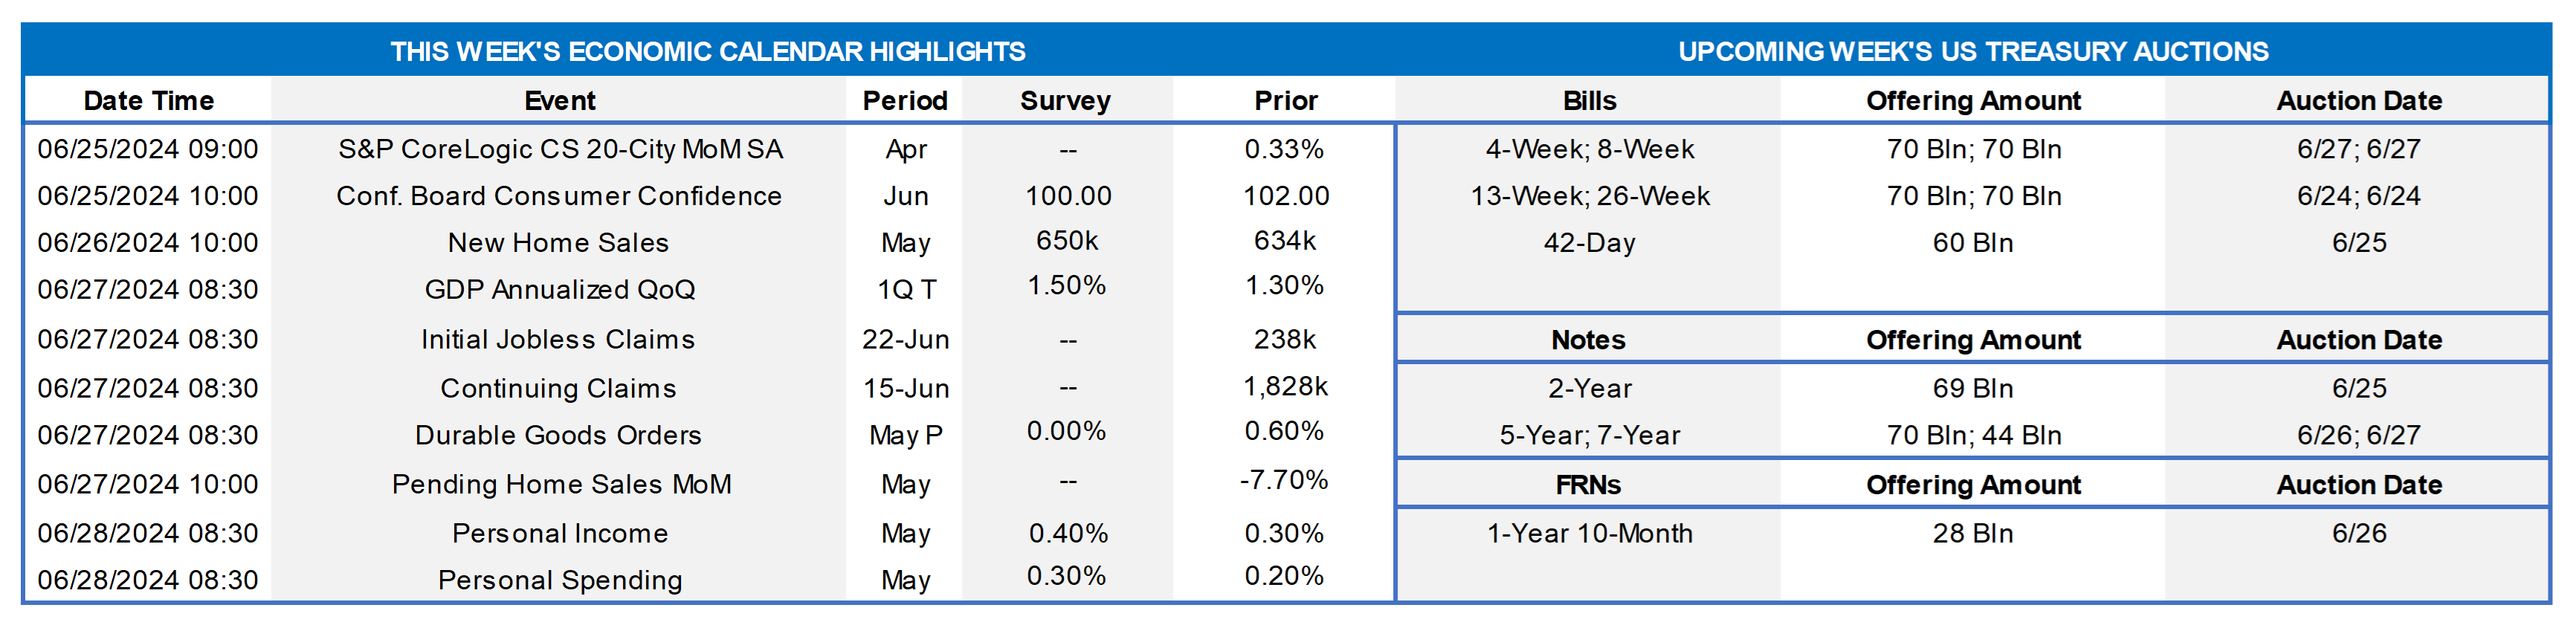
Market participants will contend with a crowded data calendar during the final week of June. Despite the number of upcoming reports, significant reassessments of Q2 activity and the monetary policy outlook likely will await the June employment situation report to be released on July 5th. A quartet of Fed officials, all current FOMC voters, will provide views on the economy and policy.
S&P CoreLogic Case-Shiller 20-City Home Price Index: Home price increases probably slowed marginally across the twenty major metropolitan areas canvassed by SPCLCS in April, rising by .28% after a .33% uptick in March. That projection, if realized, would place the SPCLCS barometer 6.9% above the level posted in April 2023.
Conference Board Consumer Confidence: Echoing the deterioration evident in the University of Michigan’s preliminary June canvass, this gauge probably retreated to 99.5 from 102 in May.
New Home Sales: Reported declines in single-family building permits and housing starts suggest that contract signings on newly constructed dwellings declined by 3% to a six-month low seasonally adjusted annual rate of 615K in May.
Real GDP Growth: The Bureau of Economic Analysis’ final pass at Q1real GDP growth is expected to reveal a slightly faster pace of aggregate activity than the 1.3% annualized clip posted in the preliminary report. Real gross domestic income for Q1 – an alternative way of measuring the economy by counting incomes earned and costs incurred in production – will also be updated.
Jobless Claims: Initial claims for unemployment insurance benefits likely retreated during the holiday shortened filing period ended June 22 from the 238K posted in the preceding week. Keep a close eye on continuing claims – the total number of persons collecting regular state benefits – for signs that recently furloughed employees are having a bit more difficult time finding work.
Durable Goods Orders: Pared by an anticipated decline in commercial jetliner requisitions, durable goods orders likely fell by 1.1% in May, reversing a little over 40% of the 2.7% gain posted over the January-March span. Excluding the projected weakness in transportation equipment bookings, hard goods orders probably eked out a modest .1% gain, after a .4% uptick in April.
Pending Home Sales: Contracts to purchase a home likely rebounded in May, reversing a portion of the surprising 7.7% dive witnessed in April.
Personal Income & Consumer Spending: Powered by a reacceleration in private wages and salaries, personal income likely climbed by .5% in May, after a .3% increase in April. Nominal consumer spending is expected to have risen by .4% during the reference period, almost matching the anticipated income gain. All eyes will be on the PCE inflation readings which are expected to echo the improvements revealed in the recent Bureau of Economic Analysis’ CPI report.
Federal Reserve Appearances:
- June 24 San Francisco Fed President Daly to give remarks on monetary policy and the economy, followed by a Q&A.
- June 25 Federal Reserve Governor Lisa Cook speaks at the Economic Club of New York.
- June 25 Fed Governor Michelle Bowman to give keynote remarks followed by a Q&A at the Midwest Cyber Workshop.
- June 28 Richmond Fed President Barkin to give keynote speech at the Global Interdependence Center’s conference in Paris.
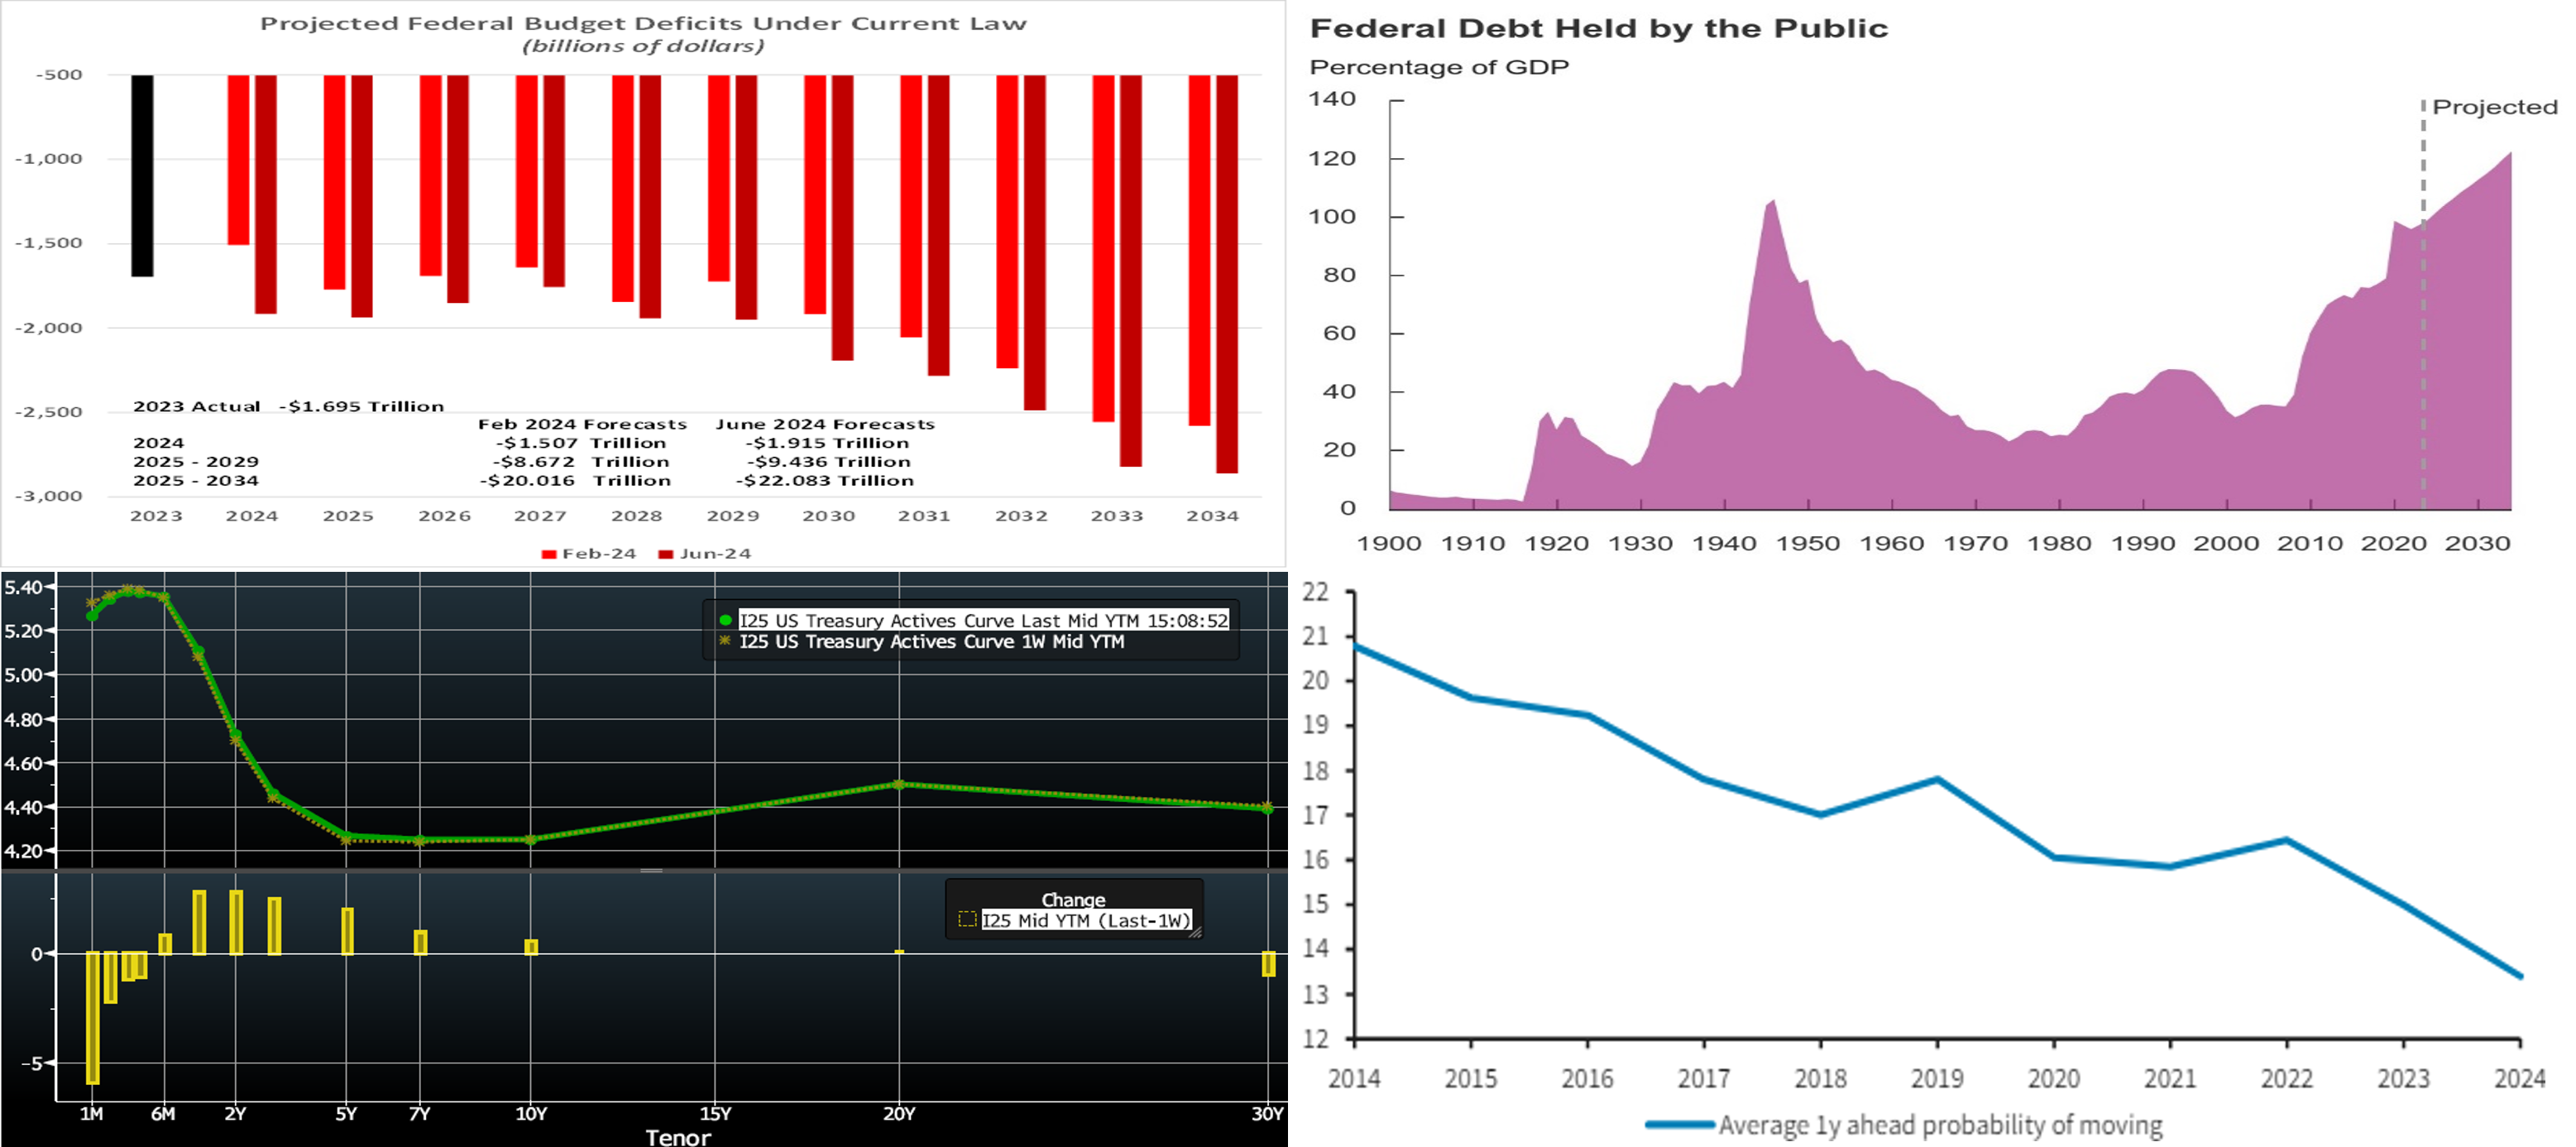
CHART 1 UPPER LEFT AND CHART 2 UPPER RIGHT
Source: Congressional Budget Office; FHLB-NY. The nonpartisan Congressional Budget Office (CBO) released updated federal budget deficit projections (Chart 1) for the next decade. In CBO’s projections, the deficit in fiscal year 2024 is $1.9trn. Adjusted to exclude the effects of shifts in the timing of certain payments, the deficit amounts to $2.0trn in 2024 and grows to $2.8trn by 2034. With such adjustments, deficits equal 7% of gross domestic product (GDP) in 2024 and 6.5% of GDP in 2025. By 2027, as revenues increase faster than outlays, they drop to 5.5% of GDP. Thereafter, outlays generally increase faster than revenues. By 2034, the adjusted deficit equals 6.9% of GDP—significantly more than the 3.7% that deficits have averaged over the past 50 years. The largest contributor to the cumulative increase was the incorporation of recently enacted legislation into CBO’s baseline, which added $1.6trn to projected deficits. That legislation included emergency supplemental appropriations that provided $95bn for aid to Ukraine, Israel, and Indo-Pacific nations. By law, that funding continues in future years in CBO’s projections (with adjustments for inflation), thereby boosting discretionary outlays by $.9trn through 2034. Given the CBO’s budget and economic projections, federal debt outstanding (Chart 2) will swell from 2024 to 2034, as increases in interest costs and mandatory spending outpace decreases in discretionary spending and growth in revenues. Indeed, debt held by the public is expected to climb from $26.2trn, or 99% of nominal GDP, this year to $50.7trn, or 122.4%, in 2034, surpassing the previous all-time high of 106% of GDP set in 1946.
CHART 3 LOWER LEFT
Source: Bloomberg. Top pane is yield (LHS, %), bottom pane is change (LHS, bps). As of Thursday afternoon, the UST term curve was, week-on-week, mostly higher but to a modest degree. The 1- to 5-year zone was higher by ~4 to 5 bps, while longer maturities were less changed. Not only was it a holiday-truncated week, but the week was also devoid of higher-tier economic releases. The data that was released generally tended to be softer-than-expectations, but rates meandered higher, nonetheless. Note that rates are lower on the month thus far and may be consolidating in a range until more impactful data is released. The 5-year SOFR swap at ~4%, for instance, is currently ~27 bps lower than its May 31st level. In terms of market-implied pricing of the Fed, there is now ~68% chance of a 25 bps rate cut priced for the September 19th FOMC; the November meeting is at 106%, or ~9% less than last week. The year-end 2024 forward is now ~4.87%, compared to last week’s 4.82%, thereby implying a cumulative total of 46 bps of cuts, or just shy of two eases, by the end of this year.
CHART 4 LOWER RIGHT
Source: Federal Reserve Bank of NY (FRB-NY) Survey of Consumer Expectations Housing Survey; Barclays Research. Homeowners’ expectations of moving in the next year (LHS,%) have notably declined in the past two years, according to data from a recent FRB-NY report. Related to higher mortgage rates, the data supports the theme that high rates are causing less housing turnover, because current homeowners are locked into low mortgage rates and are hesitant to relinquish those rates. Indeed, in the survey, homeowners reported the probability of moving within the next year at 13.6%, a historical low for the series. The data for moving within a 3-year timeframe, meanwhile, is a bit higher but still also at a series low. The probability of moving within three years was reported at 24.5% which is below the ~30 to 33% zone recorded in the mid-2010’s. The passage of time and a decrease in rates clearly appear necessary to lubricate housing market turnover.
FHLBNY Advance Rates Observations
Front-End Rates
- Short-end rates, relative to a week ago, were mildly mixed. The 1-week-and-under tenors dipped two bps, whereas 3-month-and-over tenors pushed a bp higher. Money Market Fund AUM has rebounded smartly from its mid-April tax date-related dip, while net T-bill issuance has tapered off in the past six weeks, and so the supply/demand dynamic in the short-end remains solid, and FHLB paper continues to trade tight to T-bills. Looking ahead, short-end markets will be influenced by market pricing of Fed policy.
- The market’s focus will be on data and Fed speakers in the week ahead.
Term Rates
- The longer-term curve, generally mirroring moves in USTs and swaps, was ~4 to 5 bps higher week-on-week. Please refer to the previous section for color on the changes.
- On the UST term supply front, the upcoming week serves a slate of 2/5/7-year auctions. Note that UST auctions usually occur at 1pm and can occasionally spur volatility around that time. Please contact the Member Services Desk for further information on market dynamics, rate levels, or products.
The FHLBNY is pleased to announce the 2024 0% Development Advance (ZDA) Program, now available with a new streamlined submission process. This program provides members with subsidized funding in the form of interest rate credits to assist in originating loans or purchasing loans/investments that meet the eligibility criteria under the Business Development Advance (BDA), Climate Development Advance (CDA), Infrastructure Development Advance (IDA), or Tribal Development Advance (TDA). Please contact the Member Service Desk for information and/or visit our ZDA information page.
Price Incentives for Advances Executed Before Noon: In effect as of Tuesday, September 5, 2023, the FHLBNY is pleased to now offer price incentives for advances executed before Noon each business day. These pricing incentives offer an opportunity to provide economic value to our members, while improving cash and liquidity management for the FHLBNY. For further details, kindly refer to the Bulletin.
The Symmetrical Prepayment Advance Feature
For those anticipating term funding needs, and with rates on an uptrend, it can be an appropriate juncture to consider our SPA feature. This feature allows the member to capture, at prepayment, changes in the fair value of the advance which are favorable to the member. Contact Member Services Desk to discuss.
Looking for more information on the above topics? We’d love to speak with you!
Questions?
If you wish to receive the MSD Weekly Market Update in .pdf format (includes FHLBNY rate charts) or to discuss this content further, please email the MSD Team.