Member Services Desk
Weekly Market Update
This MSD Weekly Market Update reflects information for the week ending June 14, 2024.
Economist Views
Click to expand the below image.
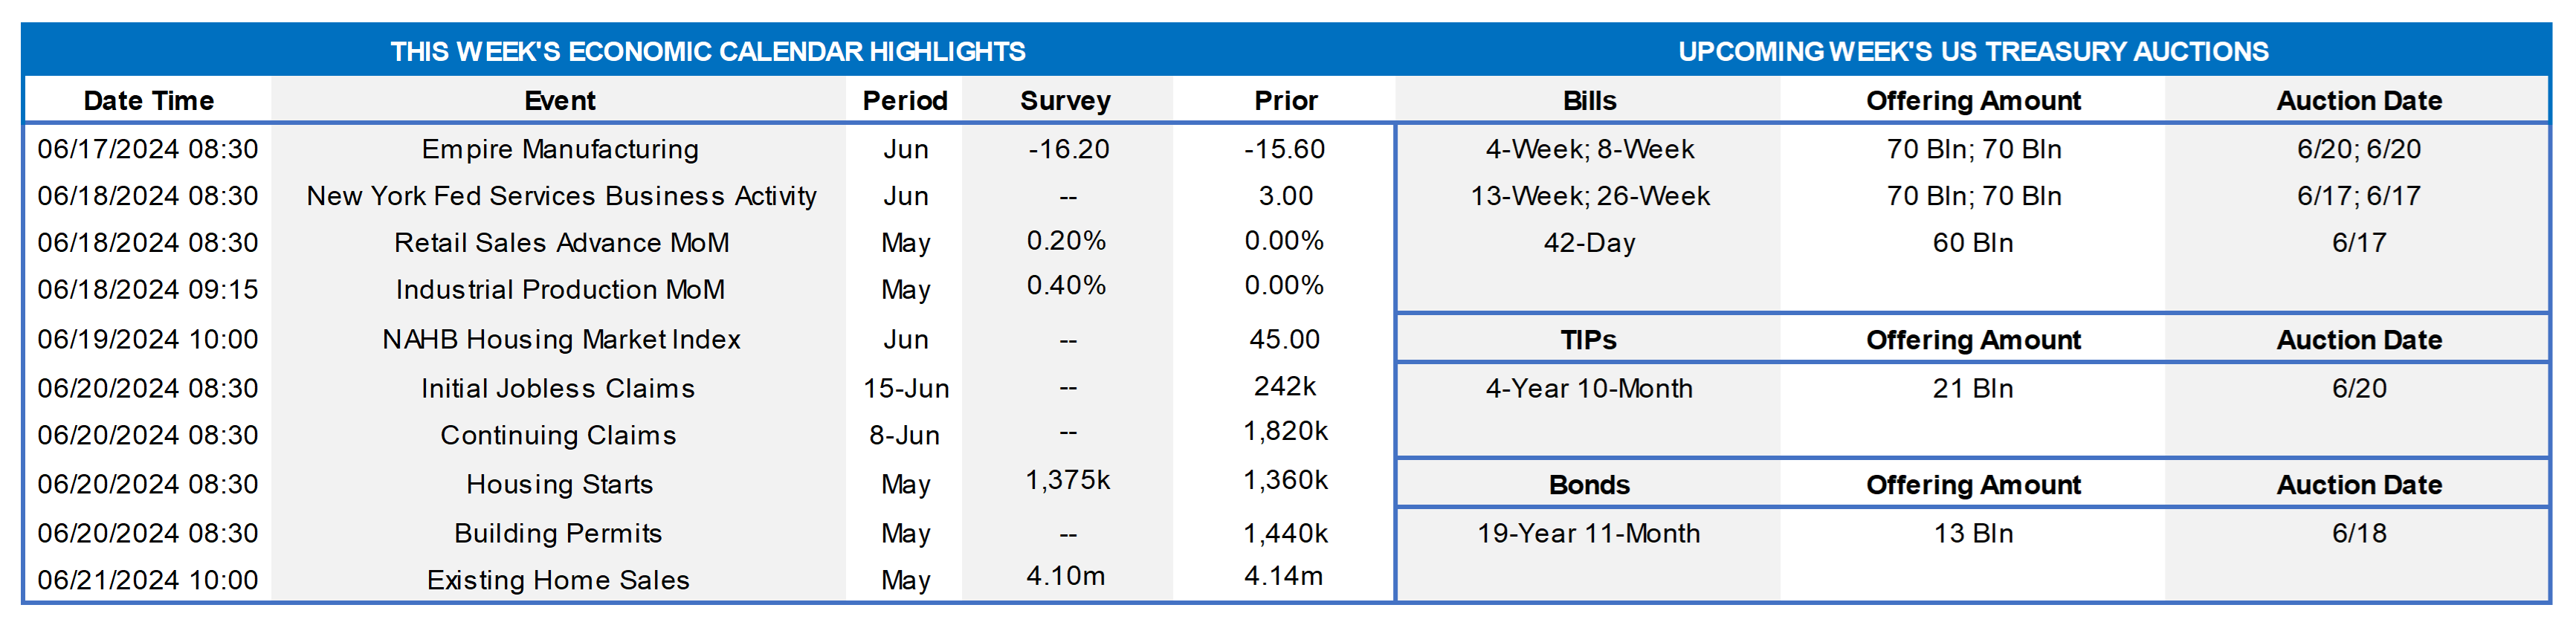
Having digested the changes in the so-called “dot plot” contained in the Federal Reserve’s Summary of Economic Projections, the market’s focus will return to gauging current-quarter growth prospects. The median economist projection calls for a return to above-trend real GDP growth near 2% annualized during Q2, but the range of forecasts is wide. Retail sales figures will help updates to projections for consumer spending, while data on industrial production and housing starts will provide important insight into business and residential investment spending. Labor market conditions are expected to have remained tight during June. Meanwhile, a half-dozen Federal Reserve officials will offer their views on the economic and monetary policy outlook.
Empire State Manufacturing Survey: Manufacturing activity in New York State likely contracted for a seventh consecutive month in June, although the general business conditions diffusion index – the percentage of survey respondents witnessing a pickup in activity less those experiencing a decline – probably improved from the -15.6% recorded in May.
New York Fed Service-Producing Activity Survey: Activity probably expanded across the NY district in June, with general business conditions diffusion index improving on May’s 3% reading.
Retail & Food Services Sales: Sales probably climbed by .4% in May, following no change in the preceding month. Excluding a projected 1% rebound in auto-dealer revenues, retail purchases are expected to have edged .3% higher, after a .2% prior-month gain. Key is to monitor so-called “control” sales excluding auto, building materials and gas purchases for clues to the pace of Q2 consumer spending. Barring any prior-month revisions, a .3% rise would leave core purchases over the April-May span 2.2% annualized above their January-March average, following 1.6% annualized Q1 gain.
Industrial Production & Capacity Utilization: A modest rise in factory output, combined with yet another weather-related jump in utilities generation, likely propelled production .4% higher in May, after no change in April. With output increases expected to eclipse additions to productive capacity during the reference period, the capacity utilization rate probably edged two ticks higher to 78.6%.
NAHB Housing Market Index: High rates likely weighed on assessments of sales and traffic in early June, leaving the HMI below the neutral 50-point level for a second straight month.
Jobless Claims: Initial claims for unemployment insurance benefits likely remained in a 215-235K range during filing period ended June 14. Continuing claims – the total number of persons collecting benefits – probably clocked in below the 1.8mn mark for a ninth straight week during the span ended June 7 – a sign that the newly unemployed are having little trouble finding work.
Housing Starts & Building Permits: The number of starts and permits likely retreated from their respective seasonally adjusted annual rates of 1.36mn and 1.44mn recorded in April.
Existing Home Sales: A reversal in home-purchase contract signings over the March-April span suggests that closings nationwide tumbled by 2.9% to a four-month low seasonally adjusted annual rate of 4.02mn in May. With the number of available homes on the market likely to expand by 3.8% to a 21-month high of 1.26mn on a not seasonally adjusted basis during the reference period, the supply at the estimated sales pace would move three ticks higher 3.8 months.
Federal Reserve Appearances:
- June 17 Philadelphia Fed President Patrick Harker to speak on the economic outlook at an event at the Philadelphia FRB.
- June 18 Richmond Fed President Thomas Barkin to speak on the US economy and Fed on a Market News International webcast.
- June 18 Federal Reserve Governor Adriana Kugler to speak at a virtual event hosted by the Brookings Institution.
- June 21 Richmond Fed President Barkin to speak on “The Recession Question” at the Richmond Risk Management Association.
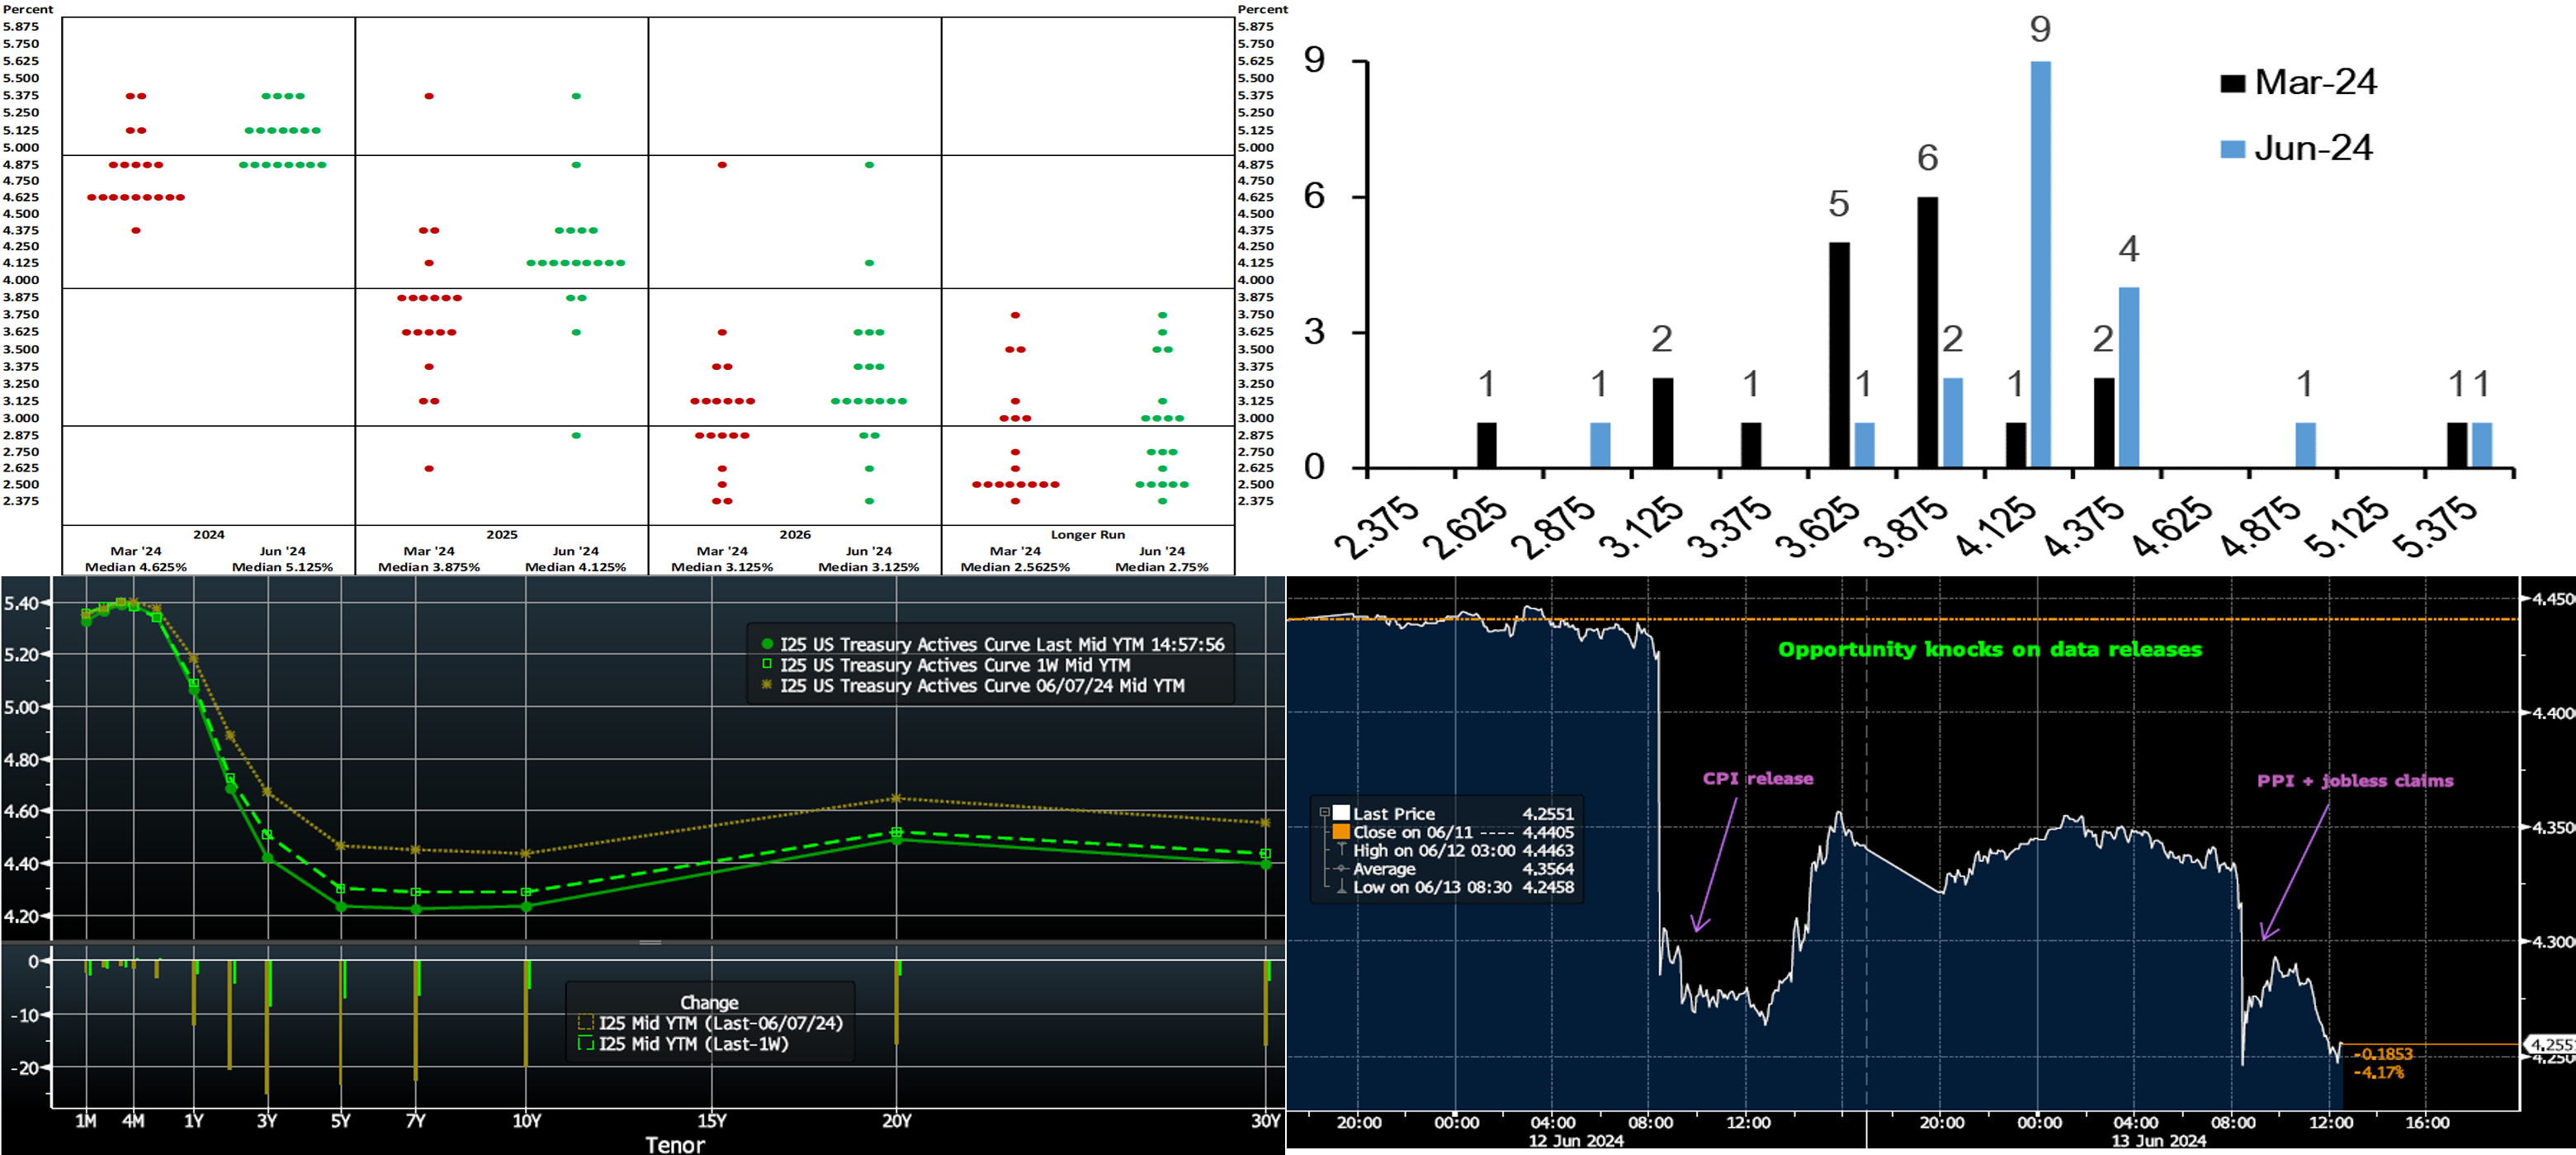
CHART 1 UPPER LEFT
Source: Board of Governors of the Federal Reserve System; FHLB-NY. While the Federal Open Market Committee (FOMC) left the target range for the fed funds rate unchanged at 5¼% to 5½%, the Summary of Economic Projections (SEP) released following this past Wednesday’s meeting contained material changes to policymakers’ year-end rate forecasts (“dot plot”) through 2025. Fed officials now anticipate only one 25-bps cut will occur this year, in contrast to the three projected in mid-March. Fed officials now expect that administered rates will fall by one full percentage point in 2025, but at 4.125% the year-end 2025 federal funds rate would be 25 bps higher than previously projected in March. The year-end 2026 median projection was unchanged at 3.125%, although the clustering around that estimate is somewhat tighter. Fed officials now expect a federal funds rate of 2.75% to prevail over the longer run — almost 19 bps above the estimate released in March. In the post-meeting press conference, Chair Powell remarked that the FOMC is “coming to think that rates won’t go to pre-Covid levels”, and this thought process would align with the upward nudge to the long-run dot.
CHART 2 UPPER RIGHT
Source: Federal Reserve; JP Morgan. The slower pace of projected cuts can be seen here, in a different format, in this comparison of the distribution of 2025 participant projections from the March and this past Wednesday’s FOMC meetings. While the 2024 projection may be considered “hawkish”, thirteen of nineteen FOMC members still expect four or more cuts in 2025. To summarize, the total number of cuts projected over the next two-and-a-half years remains at nine, or the same as March’s FOMC result, but with a slower start and subsequent faster catch-up pace.
CHART 3 LOWER LEFT
Source: Bloomberg. Top pane is yield (LHS, %), bottom pane is change (LHS, bps). As of midday Thursday, the UST curve was ~3 to 7 bps lower, led by the 3- to 5-year sector. But that belies the moves witnessed over the week. As can be seen, rates markedly retraced from last Friday’s post-employment report levels. The highlights of the past week were Wednesday’s double-feature of the CPI report and the FOMC announcement, with the former driving most of the decline in yields. In terms of market-implied pricing of the Fed, there is now ~73% chance of a 25 bps rate cut priced for the September 19th FOMC; the November meeting is at 115%. The year-end 2024 forward is 4.84%, implying a cumulative total of 49 bps of cuts, essentially two eases, by the end of this year.
CHART 4 LOWER RIGHT
Source: Bloomberg. This week’s economic data was notably market-impactful, as seen here in the behavior of the 3-year swap this past Wednesday/Thursday. Wednesday’s Consumer Price report sparked a swift drop of ~17 bps, while Thursday’s data ignited a lesser drop of ~7 bps. These observations highlight the importance of monitoring data events and having approvals for action in place, as the data releases may present opportunities for funding/investment at more optimal levels. Note that we are ready to price advances well before the Daily Rate Sheet hits your inbox. As always, please engage with the desk for information on market and/or economic trends.
FHLBNY Advance Rates Observations
Front-End Rates
- Short-end rates, relative to a week ago, were unchanged to a bp or two lower. Money Market Fund AUM has rebounded smartly from its mid-April tax date-related dip, while net T-bill issuance has tapered off in the past six weeks, and so the supply/demand dynamic in the short-end remains solid, and FHLB paper continues to trade tight to T-bills. Looking ahead, short-end markets will be influenced by market pricing of Fed policy.
- The market’s focus will be on data and the resumption of Fedspeak post the FOMC meeting.
Term Rates
- The longer-term curve, generally mirroring moves in USTs and swaps, declined by 3 to 8 bps week-over-week from last Thursday. However, relative to last Friday’s post-jobs report close, rates retraced from much higher levels. Please refer to the previous section for color on the changes.
- On the UST term supply front, the upcoming week serves a 20-year nominal and a 5-year TIPS auction. Note that UST auctions usually occur at 1pm and can occasionally spur volatility around that time. Please contact the Member Service Desk for further information on market dynamics, rate levels, or products.
The FHLBNY is pleased to announce the 2024 0% Development Advance (ZDA) Program, now available with a new streamlined submission process. This program provides members with subsidized funding in the form of interest rate credits to assist in originating loans or purchasing loans/investments that meet the eligibility criteria under the Business Development Advance (BDA), Climate Development Advance (CDA), Infrastructure Development Advance (IDA), or Tribal Development Advance (TDA). Please contact the Member Service Desk for information and/or visit our ZDA information page.
Price Incentives for Advances Executed Before Noon: In effect as of Tuesday, September 5, 2023, the FHLBNY is pleased to now offer price incentives for advances executed before Noon each business day. These pricing incentives offer an opportunity to provide economic value to our members, while improving cash and liquidity management for the FHLBNY. For further details, kindly refer to the Bulletin.
The Symmetrical Prepayment Advance Feature
For those anticipating term funding needs, and with rates on an uptrend, it can be an appropriate juncture to consider our SPA feature. This feature allows the member to capture, at prepayment, changes in the fair value of the advance which are favorable to the member. Contact Member Services Desk to discuss.
Looking for more information on the above topics? We’d love to speak with you!
Questions?
If you wish to receive the MSD Weekly Market Update in .pdf format (includes FHLBNY rate charts) or to discuss this content further, please email the MSD Team.