Member Services Desk
Weekly Market Update
This MSD Weekly Market Update reflects information for the week ending May 31, 2024.
Economist Views
Click to expand the below image.
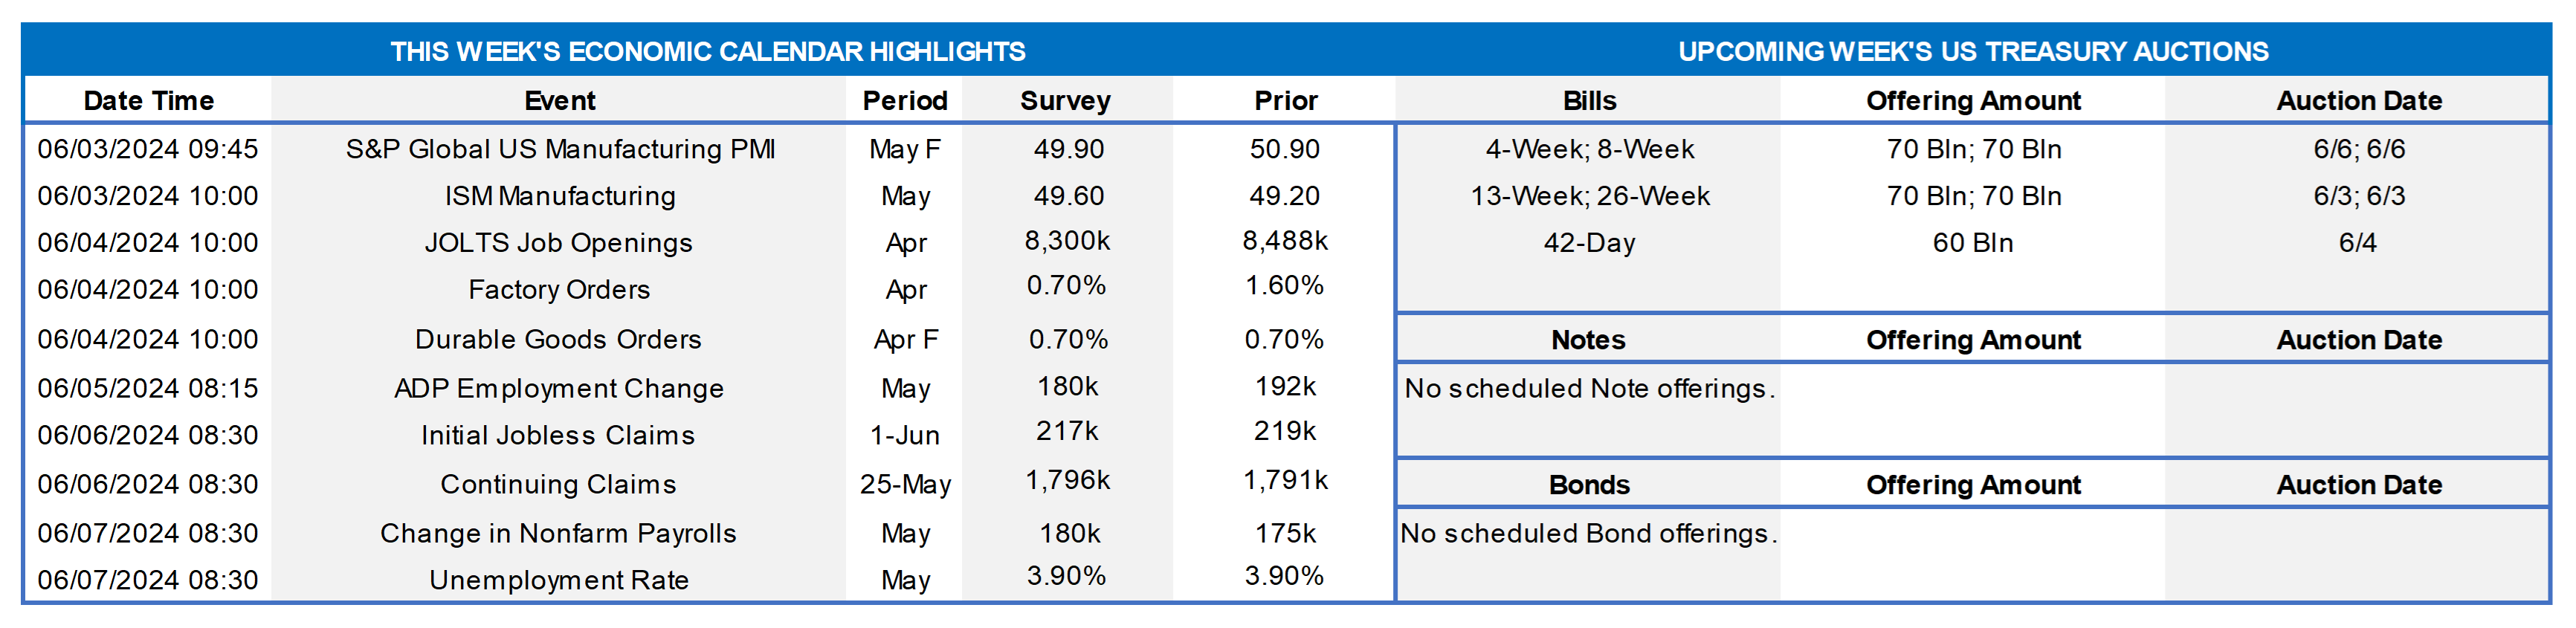
The upcoming week contains a moderately busy economic release calendar, clearly led by the June 7th employment situation report from the Bureau of Labor Statistics (BLS). Recent data has generally been supportive of the “Fed-on-hold” theme, and an ongoing sturdy jobs market has been a pillar in this regard. Therefore, the report will warrant the market’s scrutiny. With the June 11-12 FOMC meeting fast approaching, the Fed will enter blackout mode on speeches/comments, so the economic data should serve as the main catalyst for any rate moves.
S&P Global US Manufacturing PMI: Economists expect a small month-over-month decrease of 1.0 in this index.
ISM Manufacturing: A small increase is expected for the May reading of the Institute for Supply Management manufacturing index.
Factory Orders: Orders are expected to reflect a decrease of .90% month-over-month.
JOLTS Job Openings: The BLS’ Job Openings and Labor Turnover Survey is expected to reveal a 188K decrease month-on-month. This report should be interesting to monitor, as it may portend some loosening in labor markets via less openings and more workers available to fill openings.
Durable Goods Orders: Orders for the month of May are expected to be flat to April’s figure of 0.70%.
ADP Employment Change: The report is expected to reflect a slight decrease from last month’s reading but still an increase of 180K jobs.
Initial and Continuing Claims: Claims are expected to be close to the previous week’s readings – approximately 217K in Initial and 1.79mn for Continuing.
Change in Nonfarm Payrolls: Expectation for the Nonfarm Payroll report is an increase of 180K jobs for May.
Unemployment rate: With the increase of 180K jobs in May, market surveys predict that the unemployment rate will remain unchanged at 3.9%.

CHART 1 UPPER LEFT
Source: National Association of Home Builders (NAHB); Wells Fargo (WF); FHLB-NY. Late last week, NAHB/WF reported its new (replaces the Housing Opportunity Index) Cost of Housing Index (CHI) – a quarterly analysis of housing costs in the US and specific metro areas. The CHI is calculated as the ratio of mortgage payment over median family income. The mortgage payment is calculated by taking the median home price, assuming a 10% downpayment, and adding taxes, homeowner’s insurance, and private mortgage insurance. Median family income (the denominator) is derived from data provided by the Department of Housing and Urban Development. The CHI represents the portion of a typical family’s income needed to make a mortgage payment on a median-priced home. For example, a reading of 41% means an owner would need to allocate 41% of their pre-tax income to cover the mortgage payment for a median-priced home. As can be seen here, costs retreated both nationally and across segments of our district in Q1 but remained above those witnessed a year ago. Costs varied widely across the FHLB-NY district in Q1, ranging from a low of 16% in Elmira, NY, to a high of 50% in the NY-Newark-Jersey City, NY-NJ-PA metro statistical area. Additionally, NAHB/WF will produce a low-income cohort CHI to examine the cost of housing for those earning 50% of an area’s median income.
CHART 2 UPPER RIGHT
Source: Bloomberg. Top pane is yield (LHS, %), bottom pane is change (LHS, bps). The UST curve tacked higher and steeper by ~15 to 19 bps in the two weeks since our last publication. Economic data and Fedspeak have generally reinforced the Fed-on-hold theme and a need to witness sustained progress on inflation before any rate cuts can be considered. Meanwhile, this past week served a heavy slate of UST auctions, which did not fare well and added further upward pressure on rates. However, as of Thursday afternoon and post a slightly softer-than-consensus GDP report, yields had retraced ~5 to 6 bps from the week’s highest levels. In terms of market-implied pricing of the Fed, a full 100% probability of a 25 bps cut has been pushed back to December, with the June 13th FOMC priced at zero chance. The August 1st FOMC is priced at ~8%, or ~17% lower than two weeks ago, with a chance of the first 25 bps cut. The year-end 2024 forward is 4.995%, or ~10 bps higher than two weeks ago, implying a cumulative total of 33.5 bps of cuts by the end of this year. The market will closely monitor the employment-related data in the upcoming week.
CHART 3 LOWER LEFT
Source: Bloomberg. Further on the housing cost theme, shown here are a few results of the latest University of Michigan Consumer Sentiment Survey. In terms of homebuying conditions being deemed unfavorable/bad (Gold, RHS, %) vs. favorable/good (White, RHS, %), the results reflect historically high levels for the former and low levels for the latter. In simple terms, a significantly high proportion of respondents deem conditions as not good. Given the dramatic increase in mortgage rates of the past year so, these results make intuitive sense. And the dynamics of tight supply, high prices, and higher insurance costs also play a part. Notably, the unfavorable sentiment is higher than 1980’s levels when mortgage rates reached the high teens; perhaps the recent increase in rates, on a relative basis and from the historically low levels of a few years ago, accounts for this difference.
CHART 4 LOWER RIGHT
Source: Bloomberg Intelligence; National Association of Realtors; Census Bureau. Here is a potential kernel of good news for homebuying costs, at least from the supply/demand standpoint. Existing-home inventories (Blue, RHS, 000’s), while still relatively low on a historic basis, are now ~16% above year-ago levels and higher than at any point in 2023. New-home inventories (Orange, RHS, 000’s), meanwhile, are at the highest levels since the late 2000’s.
FHLBNY Advance Rates Observations
Front-End Rates
- Short-end rates, relative to two weeks ago, were unchanged to a bp higher; the 6-month was two bps higher. Money Market Fund AUM has rebounded from its mid-April tax date-related dip, while net T-bill issuance has tapered off in the past month, and so the supply/demand dynamic in the short-end remains solid. Looking ahead, short-end markets will remain most influenced by data and the market’s pricing of the Fed.
- With the Fed in blackout mode this upcoming week, the market’s focus will be on economic data, especially the Friday jobs report.
Term Rates
- The longer-term curve, generally mirroring moves in USTs and swaps, traced higher and steeper from two weeks ago. While the 2-year was 15 bps higher, the 5- and 7-year were 19 and 20 bps higher, respectively. Please refer to the previous section for color on the changes.
- On the UST term supply front, the upcoming week serves as a reprieve from auctions. Note that UST auctions usually occur at 1 pm and can occasionally spur volatility around that time. Please contact the Member Services Desk for further information on market dynamics, rate levels, or products.
The FHLBNY is pleased to announce the 2024 0% Development Advance (ZDA) Program, now available with a new streamlined submission process. This program provides members with subsidized funding in the form of interest rate credits to assist in originating loans or purchasing loans/investments that meet the eligibility criteria under the Business Development Advance (BDA), Climate Development Advance (CDA), Infrastructure Development Advance (IDA), or Tribal Development Advance (TDA). Please contact the Member Service Desk for information and/or visit our ZDA information page.
Price Incentives for Advances Executed Before Noon: In effect as of Tuesday, September 5, 2023, the FHLBNY is pleased to now offer price incentives for advances executed before Noon each business day. These pricing incentives offer an opportunity to provide economic value to our members, while improving cash and liquidity management for the FHLBNY. For further details, kindly refer to the Bulletin.
The Symmetrical Prepayment Advance Feature
For those anticipating term funding needs, and with rates on an uptrend, it can be an appropriate juncture to consider our SPA feature. This feature allows the member to capture, at prepayment, changes in the fair value of the advance which are favorable to the member. Contact Member Services Desk to discuss.
Looking for more information on the above topics? We’d love to speak with you!
Questions?
If you wish to receive the MSD Weekly Market Update in .pdf format (includes FHLBNY rate charts) or to discuss this content further, please email the MSD Team.