Member Services Desk
Weekly Market Update
This MSD Weekly Market Update reflects information for the week ending May 17, 2024.
Economist Views
Click to expand the below image.
Please note that the MSD Weekly Update will pause next week for the Memorial Day weekend return on Friday, May 31.
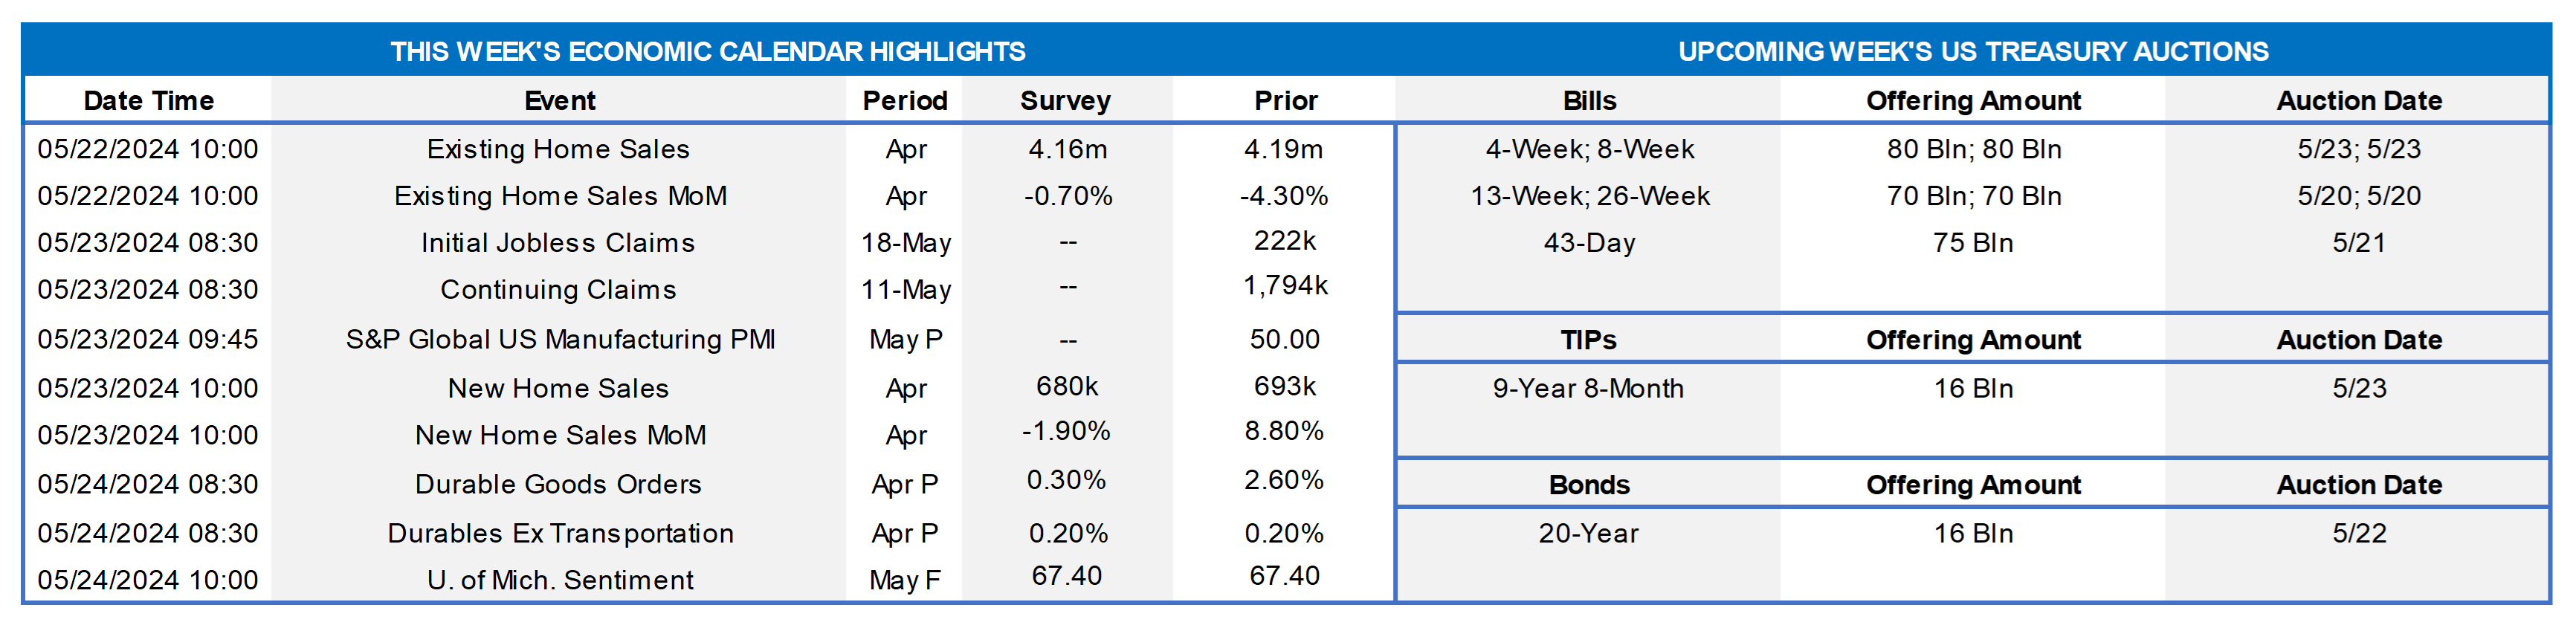
Market participants will face a comparatively light statistical calendar in the upcoming week. Closings on existing dwellings probably rebounded last month, while durable goods bookings took a breather. Consumer confidence likely bounced in the latter half of May, reversing a portion of the deterioration witness in the early part of the month. The Department of Labor’s jobless claims report will bring economists one step closer to finalizing their forecasts for the May employment report to be released in the first week of June. Nonfarm payrolls appear poised to rise by 240K, with the unemployment rate rounding down a tick to 3.8%. The market will also decipher almost a dozen public appearances by Federal Reserve officials, almost all of whom are current FOMC voters.
Existing Home Sales: A rebound in home-purchase contract signings over the February-March span suggests that closings nationwide rose by 2% to a seasonally adjusted annual rate of 4.28mn in April, eclipsing the 4.19mn average posted over the winter quarter. With the number of available homes on the market likely to jump by 7.2% to an 18-month high of 1.19mn on a not seasonally adjusted basis during the reference period, the supply at the estimated sales pace would edge one tick higher to 3.3 months.
Jobless Claims: Initial claims for unemployment insurance benefits likely remained in a range of 205-225K during the filing period ended May 18. Continuing claims – the total number of persons collecting benefits – probably registered below the 1.8mn mark for a sixth straight week during the span ended May 4 – a sign that the newly unemployed are having little trouble finding work.
Durable Goods Orders: Pared by an anticipated falloff in commercial jetliner requisitions, durable goods orders likely fell by 1% in April, almost half of the 2.1% gain posted over the January-February span. Excluding the projected weakness in transportation equipment bookings, hard goods orders probably posted a modest .2% gain, after no change in the prior month.
Michigan Sentiment Index: Buoyed by the modest inflation improvement witnessed in April, the University of Michigan’s consumer confidence gauge probably climbed to 70 in the final May report from the preliminary 67.4 estimate issued two weeks earlier.
Federal Reserve Appearances:
- May 20 Atlanta Fed President Bostic to give welcoming remarks at the Atlanta Fed’s Financial Markets Conference.
- May 20 Fed Vice Chair for Supervision Michael Barr to give keynote at the Atlanta Fed’s Financial Markets Conference.
- May 20 Atlanta Fed President Bostic to moderate a discussion with Harvard’s Ed Glaeser at the Atlanta Fed Conference.
- May 21 Richmond Fed President Barkin to give remarks at the Richmond Fed’s Investing in Rural America conference.
- May 21 Fed Governor Waller to speak on his outlook for the US economy and monetary policy.
- May 21 New York Fed President Williams gives opening remarks at the 2024 Governance and Culture Reform Conference.
- May 21 Atlanta Fed President Bostic to offer brief welcoming remarks at day 2 of the Atlanta Fed Conference.
- May 21 Boston Fed President Collins and Cleveland Fed President Mester to take part in a discussion at the Atlanta Fed Conference.
- May 22 Federal Reserve to release minutes from April 30 – May 1 FOMC meeting.
- May 23 Atlanta Fed President Bostic to participate in a Q&A session with an MBA class at Stanford University.
- May 24 Fed Governor Waller to give keynote address at a Central Bank of Iceland event in Reykjavík.
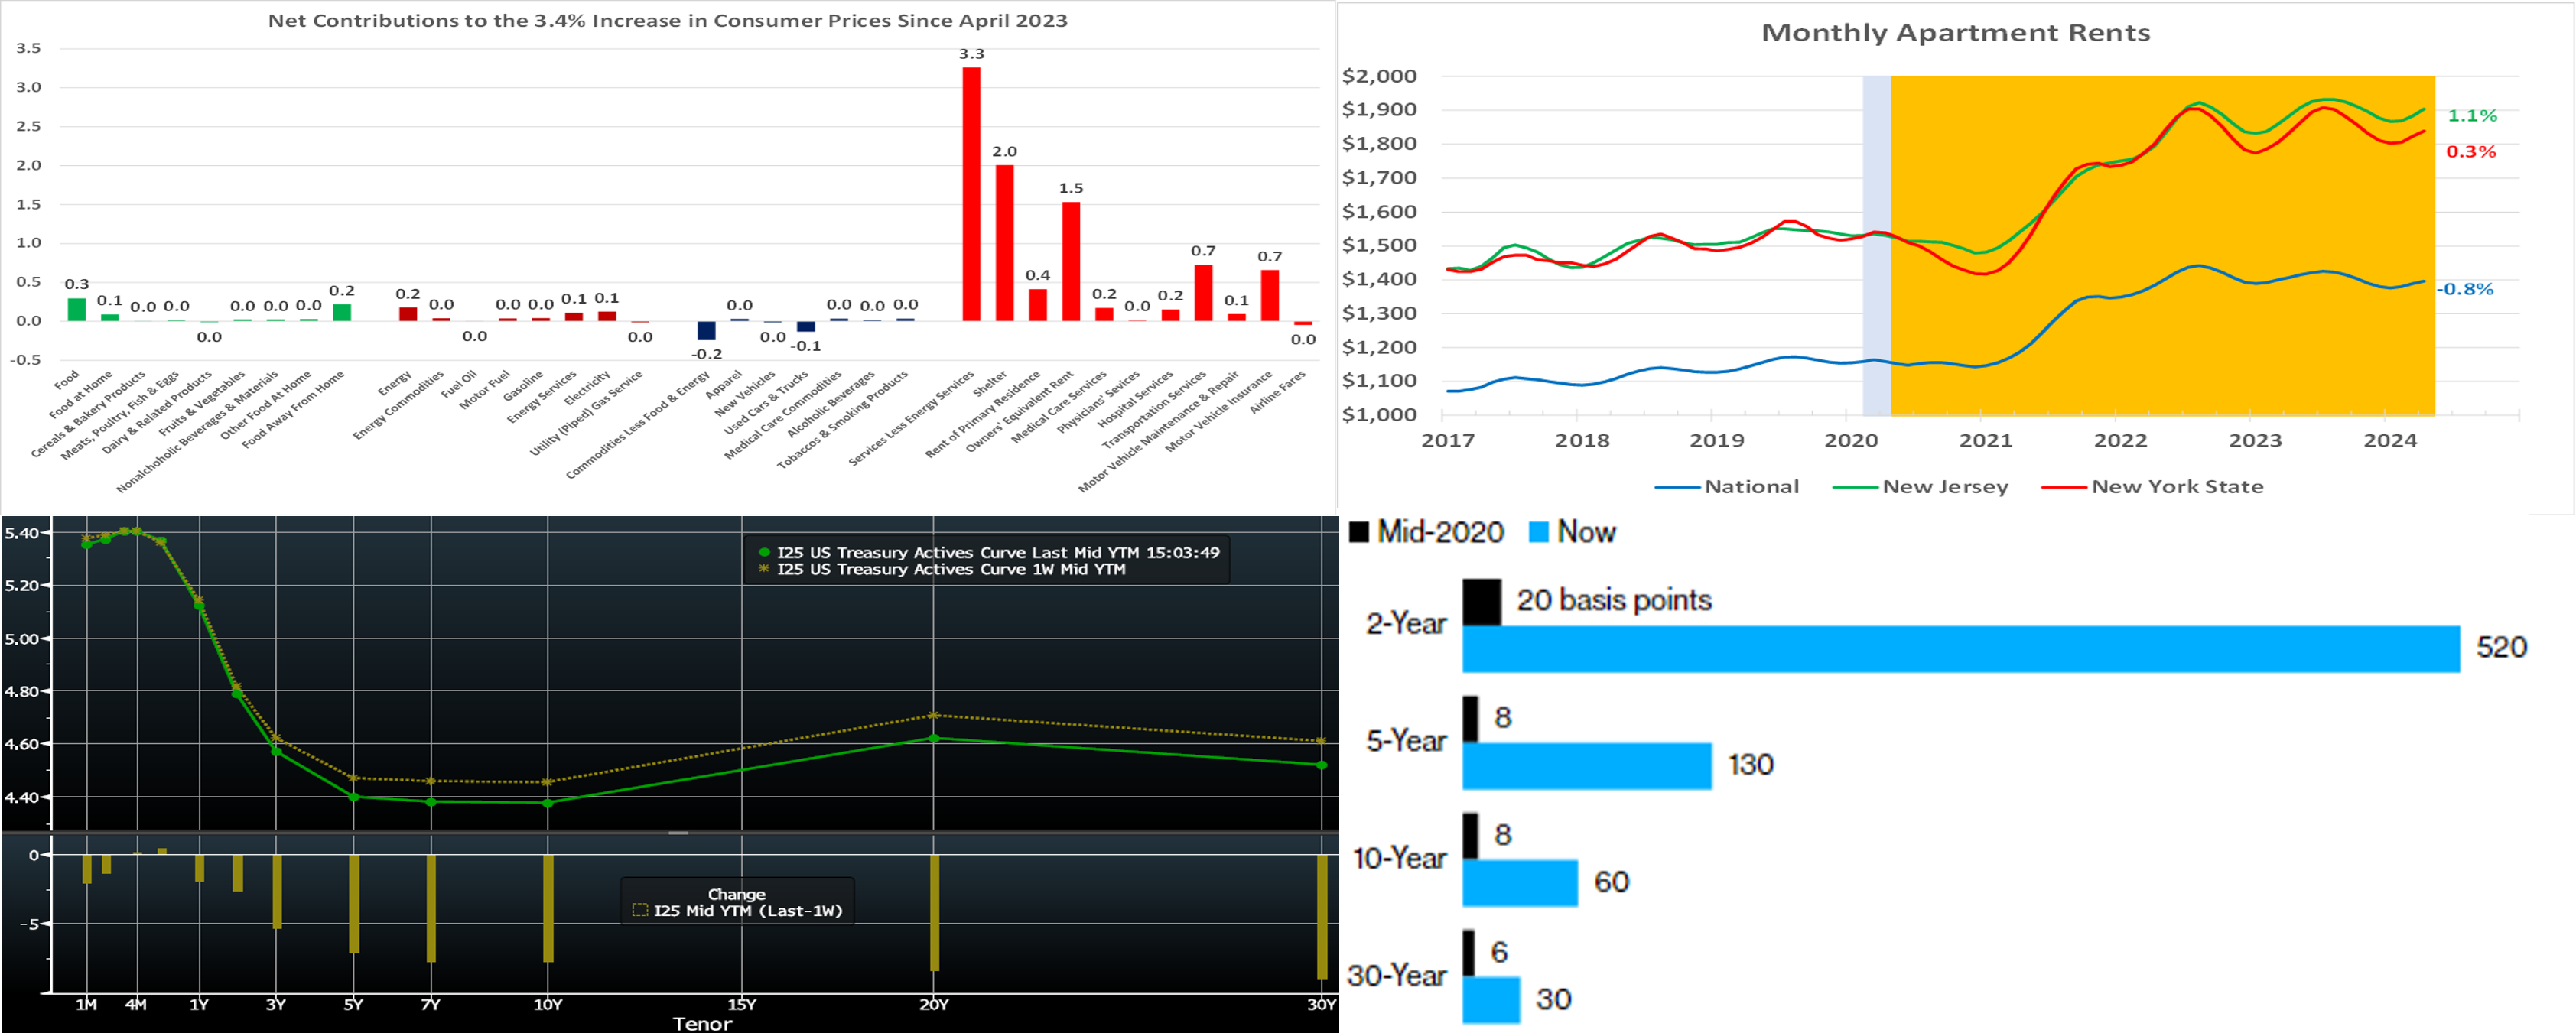
CHART 1 UPPER LEFT
Source: Bureau of Labor Statistics (BLS); FHLB-NY. The BLS reported this past Wednesday that both the overall and core Consumer Price Indexes (CPI) edged .3% higher in April. The year-to-year growth of the two gauges slowed to 3.4% and 3.6% respectively during the reference period from 3.5% and 3.8% in March. While the FOMC expressed its concern about the lack of further progress toward the 2% inflation objective following its recent meeting, it is important to note that the rise in consumer goods and services costs since April 2023 has been especially narrow, as seen here (kindly magnify for a closer view). Indeed, non-energy services costs, primarily those for shelter and auto insurance, have been the drivers of increases in the overall and core CPIs over the latest 12 months. Publicly sensitive segments such as food and energy products have had a very modest impact on consumer price inflation.
CHART 2 UPPER RIGHT
Source: Apartment List; National Bureau of Economic Research; FHLB-NY. Notes: Blue-shaded areas denote recession, orange-shaded highlights economic expansion; percentage changes are from April 2023. The growth rates of apartment rents continue to ebb across the country and within the FHLB-NY district. The national average apartment rent climbed by .5% to $1,396 in April, leaving last month’s figure .8% below that of a year ago. While average rents across NJ and NYS edged higher as well, their respective 12-month increases of just 1.1% and .3%, respectively, paled in comparison to the 18.2% and 22.7% of early 2022. Running significantly cooler than corresponding CPI measures, these series offer some hope that a significant slowing in CPI readings may soon be at hand.
CHART 3 LOWER LEFT
Source: Source: Bloomberg. Top pane is yield (LHS, %), bottom pane is change (LHS, bps). From last Thursday afternoon to this one, the UST curve moved lower and modestly flatter. While the 2-year declined ~2 bps, the 5- and 10-year declined ~6 and 7 bps, respectively. The bulk of the move occurred on Wednesday post the somewhat comforting CPI release; indeed, yields were at even lower levels but subsequently retraced higher on Thursday. In terms of market-implied pricing of the Fed, a full 100% probability of a 25 bps cut is still November, with the June 13th FOMC priced at only ~2% chance. The August 1st FOMC is priced at ~25%, or ~9% lower than last week, chance of the first 25 bps cut. The year-end 2024 forward is 4.895%, or ~1.5 bps higher than last week, implying a cumulative total of 43.5 bps of cuts by the end of this year. The market will monitor a heavy dose of Fed speakers in the upcoming week.
CHART 4 LOWER RIGHT
Source: Bloomberg. With summer approaching, it is currently much “safer to go in the water” in fixed income than a few years ago! Shown here is the number of basis points that UST yields need to rise in one year to “wipe out” interest income. In other words, shown is the degree of yield increase that would cause a decline in the bond’s price equivalent to the interest income and, in turn, a negative total return. While rising yields thus far have been challenging for funding costs and existing securities portfolios, a higher yield complex can provide opportunities for those in asset sensitive positions. While, for now at least, leaving funds in cash currently earns a superior yield, this dynamic will change if the Fed were to potentially cut rates more than implied by the current yield curve. In sum, and especially in shorter duration securities, prevailing yield levels offer a much better cushion against price loss than in prior years.
FHLBNY Advance Rates Observations
Front-End Rates
- Short-end rates, week-over-week, were mostly a bp lower. Money Market Fund AUM has rebounded from its mid-April tax date-related dip, while net T-bill issuance has tapered off in the past month, and so the supply/demand dynamic in the short-end remains solid. Looking ahead, short-end markets will remain most influenced by data and the market’s pricing of the Fed.
- In the forthcoming week, market focus will center on the relatively light data but decidedly heavy Fedspeak calendars.
Term Rates
- The longer-term curve, week-on-week and generally mirroring moves in USTs and swaps, moved lower and modestly flatter. While the 2-year declined 2 bps, the 3- and 5-year declined by 6 and 7 bps, respectively. Please refer to the previous section for color on the changes.
- On the UST term supply front, the upcoming week serves a 10-year TIPS and a 20-year nominal auction. Note that UST auctions usually occur at 1pm and can occasionally spur volatility around that time. Please contact the Member Services Desk for further information on market dynamics, rate levels, or products.
The FHLBNY is pleased to announce the 2024 0% Development Advance (ZDA) Program, now available with a new streamlined submission process. This program provides members with subsidized funding in the form of interest rate credits to assist in originating loans or purchasing loans/investments that meet the eligibility criteria under the Business Development Advance (BDA), Climate Development Advance (CDA), Infrastructure Development Advance (IDA), or Tribal Development Advance (TDA). Please contact the Member Service Desk for information and/or visit our ZDA information page.
Price Incentives for Advances Executed Before Noon: In effect as of Tuesday, September 5, 2023, the FHLBNY is pleased to now offer price incentives for advances executed before Noon each business day. These pricing incentives offer an opportunity to provide economic value to our members, while improving cash and liquidity management for the FHLBNY. For further details, kindly refer to the Bulletin.
The Symmetrical Prepayment Advance Feature
For those anticipating term funding needs, and with rates on an uptrend, it can be an appropriate juncture to consider our SPA feature. This feature allows the member to capture, at prepayment, changes in the fair value of the advance which are favorable to the member. Contact Member Services Desk to discuss.
Looking for more information on the above topics? We’d love to speak with you!
Questions?
If you wish to receive the MSD Weekly Market Update in .pdf format (includes FHLBNY rate charts) or to discuss this content further, please email the MSD Team.