Member Services Desk
Weekly Market Update
This MSD Weekly Market Update reflects information for the week ending May 10, 2024.
Economist Views
Click to expand the below image.
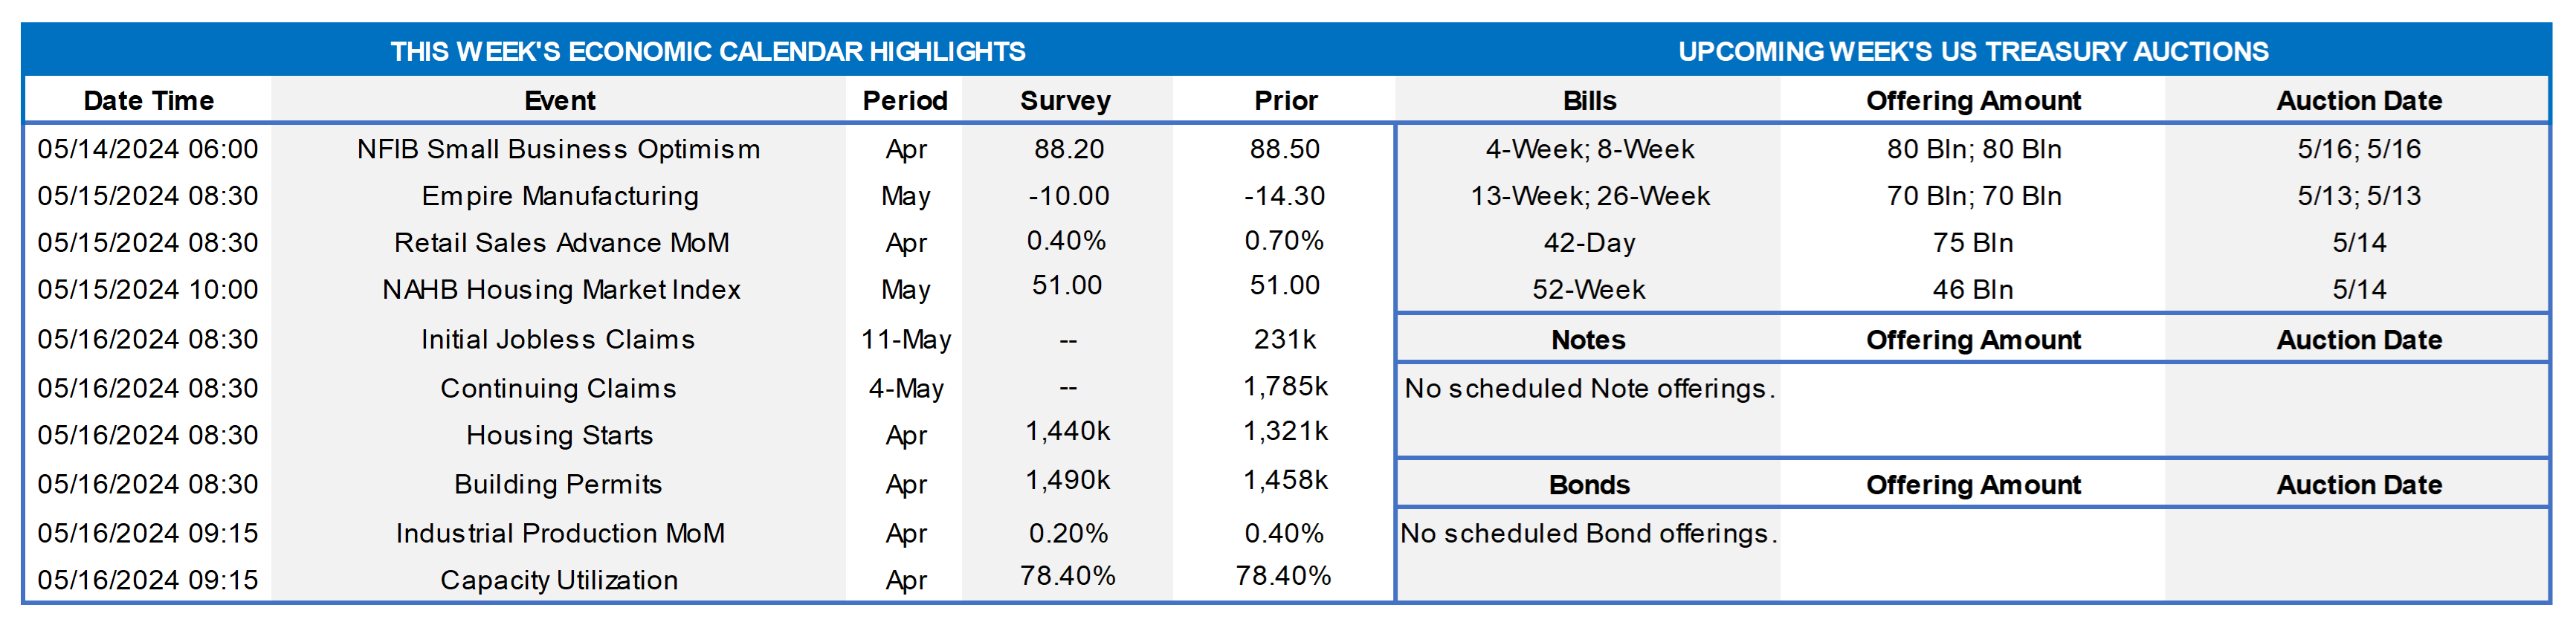
Market participants will face a heavy data calendar, in addition to multiple Fed speakers, this week. Wednesday’s Consumer Price Index (CPI) update for April will surely be the marquee report. Capped by an anticipated deceleration in non-energy goods and services costs, CPI likely rose by .3% in April, following a pair of .4% increases in February and March. Lower motor vehicle costs during the reference period may have limited the rise in the so-called core CPI excluding volatile food and energy components to .3%, after a triplet of unexpected .4% hikes during the January through March span. Those projections, if realized, would place the overall and core CPIs 3.3% and 3.6% above their respective year-ago levels – both still above the Fed’s desired 2% target.
Empire State Manufacturing Survey: Activity in NYS likely contracted for a sixth straight month in May, with the net percentage of respondents experiencing a falloff in activity narrowing to -10% from -14.3% in the previous month.
Retail & Food Services Sales: Sales probably climbed by .4%, after a larger-than-expected .7% gain in March. Excluding a projected 1.3% rebound in auto-dealer revenues, retail purchases also are expected to have edged .2% higher during the reference period, after a solid 1.1% prior-month jump. Economists will focus on so-called “control” sales, excluding auto, building materials, and gas, for clues to the pace of Q2 consumer spending. Barring any prior-month revisions, a .1% rise would leave core purchases at the beginning of Q2 4% annualized above their January-March average, following a 3.1% annualized Q1 gain.
NAHB Housing Market Index (HMI): Homebuilders’ appraisals of sales and prospective buyer traffic probably improved slightly in May, lifting the index by one point to a ten-month high of 52. Keep an eye on the regional details in this week’s report. At 65 in April, the HMI for homebuilders in the Northeast eclipsed the remainder of the Nation by a wide margin.
Jobless Claims: Initial claims for unemployment insurance benefits likely remained in a range of 205-225K during the filing period ended May 11. Continuing claims – the total number of persons collecting benefits – probably clocked in below the 1.8mn mark for a fourth straight week during the span ended May 4 – a sign that the newly unemployed are having little trouble finding work.
Housing Starts & Building Permits: Buoyed by favorable weather conditions, new residential construction activity probably rebounded in April, with the number of new housing units started and building permits issued rising by 12% and 1.6%, respectively, to seasonally adjusted annual rates of 1.48mn and 1.49mn.
Industrial Production & Capacity Utilization: Production at the Nation’s factories, mines and utilities is expected to have climbed by .2% in April, following a .4% gain in March. With output increases expected to match additions to productive capacity during the reference period, the capacity utilization rate probably held steady at 78.4%.
Leading Indicators: The Conference Board’s augur of future economic activity likely dipped by .2% in April, following a .3% decline in March. Aside from this data point, the economy has shown few signs of faltering. Indeed, the Federal Reserve Bank of St. Louis’ recession probability model placed the chances that the economy was contracting in March at a negligible .5%.
Federal Reserve Appearances:
- May 13 Cleveland Fed President Mester and Fed Vice Chair Philip Jefferson to discuss central bank communications.
- May 14 Fed Chair Powell and ECB council member Klaas Knot to speak at an event organized by the Netherlands FBA.
- May 16 Cleveland Fed President Mester to give remarks on the economic outlook followed by an audience Q&A.
- May 16 Atlanta Fed President Bostic to participate in a moderated conversation about the outlook in Jacksonville, FL.
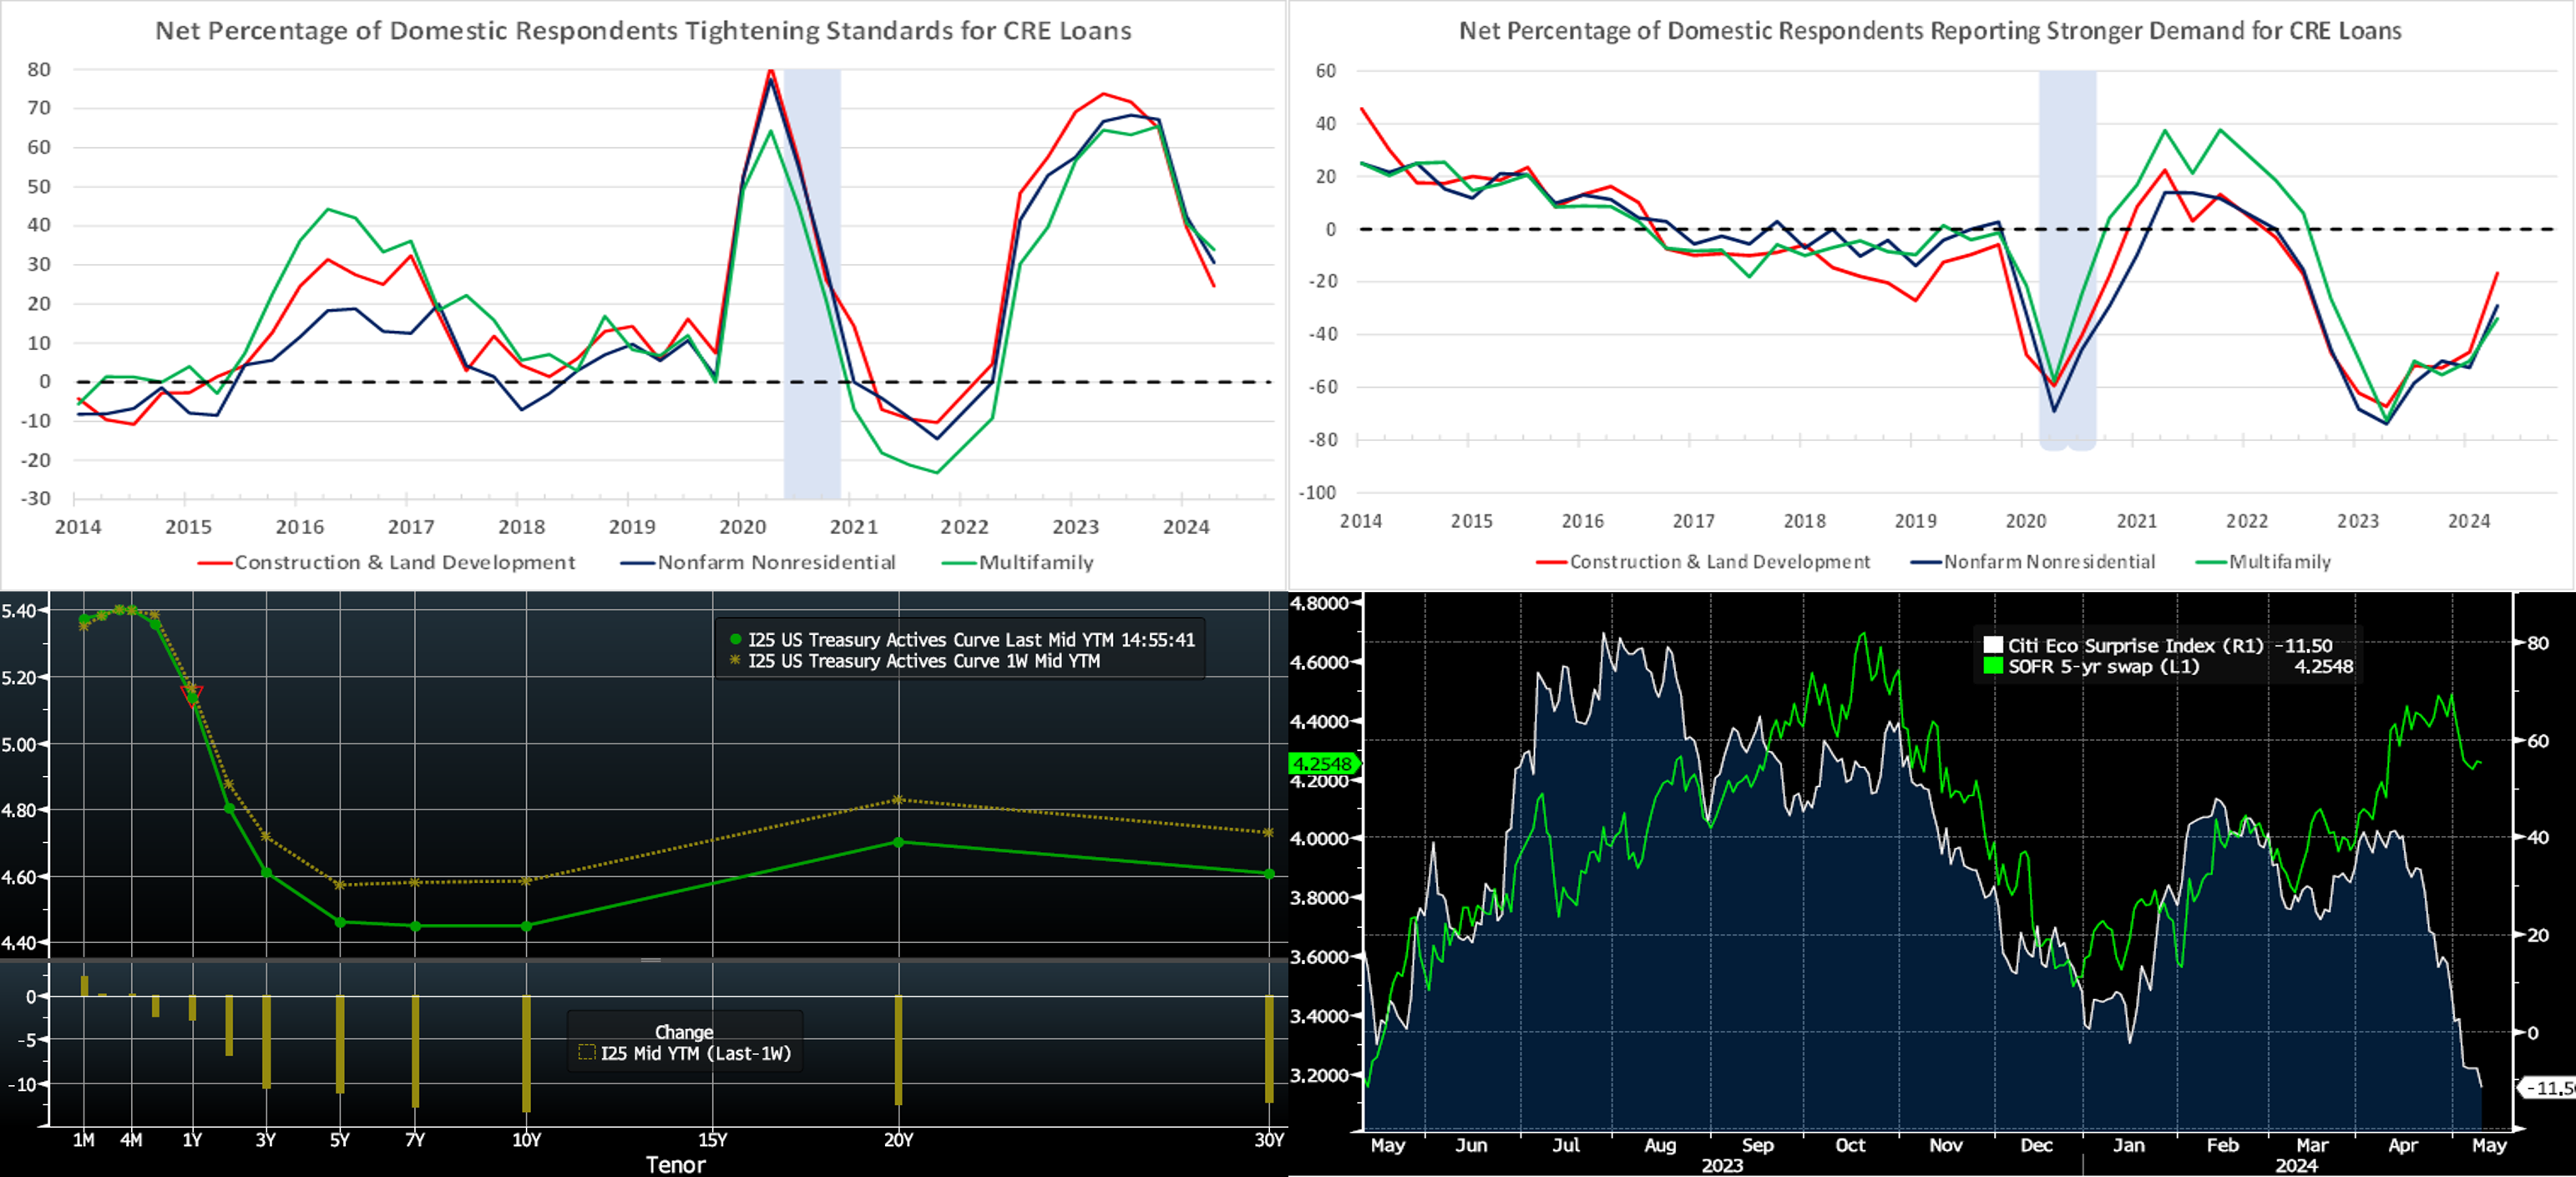
CHART 1 UPPER LEFT and CHART 2 UPPER RIGHT
Source: Federal Reserve Board; National Bureau of Economic Research; FHLB-NY. Note: Shaded areas denote recessions. The Federal Reserve Board’s April 2024 Senior Loan Officer Opinion Survey on Bank Lending Practices, or “SLOOS,” indicated that standards continued to firm across all types of CRE loans – construction & land development, nonfarm residential and multifamily – during the first quarter (see Chart 1 Left). Significant net shares of banks reported tightening maximum loan sizes, lowering loan-to-value ratios, increasing debt service coverage ratios, and shortening interest-only payment periods for all CRE loan types. Demand for CRE borrowings remained weak across the board in the April SLOOS (see Chart 2 Right). The net percentage of respondents reporting stronger demand for construction & land development loans registered at -16.7%, extending the streak of negative readings that began in the winter of 2022. The gauge of nonfarm nonresidential lending registered at -29.0%, after a -52.2% reading in the January SLOOS. At -33.9%, the diffusion index for multifamily loan demand was the weakest of the lot during the first three months of 2024.
CHART 3 LOWER LEFT
Source: Bloomberg. Top pane is yield (LHS, %), bottom pane is change (LHS, bps). From last Thursday afternoon to this one, the UST curve moved lower and flatter. While the 2-year declined by ~7 bps, the 5-year dropped by ~11 and the 10-year by ~13 bps. Much of the move occurred in response to last Friday’s softer-than-expected jobs report in an otherwise quiet data week. Our Chief Economist warns that this jobs report may be ripe for revisions in the next release, so this space will be key to monitor. The past week’s slate of 3/10/30-year UST auctions was absorbed without impact and thereby provided relief from any upward pressure on yields. In terms of market-implied pricing of the Fed, a full 100% probability of a 25 bps cut is still November, with the June 13th FOMC priced at only ~7% chance. The August 1st FOMC is priced at ~34%, roughly the same as last week, with a chance of the first 25 bps cut. The year-end 2024 forward is 4.88%, or 6 bps lower than last week, implying a cumulative total of 45 bps of cuts by the end of this year.
CHART 4 LOWER RIGHT
Source: Bloomberg; Citibank. Shown here is the Citibank Economic Surprise Index (RHS, White), which measures data surprises relative to market expectations, with positive readings revealing that data releases have been stronger than market consensus expectations and negative readings revealing that releases have been weaker than expectations. Also charted is the 5-year SOFR swap rate (LHS, Green, %). As seen here, and which makes intuitive sense, rates tend to follow the direction of the Surprise index. After months in positive territory in Q1, the Surprise index has declined since mid-April and even turned negative in early-May, the latter likely a result of weaker-than-expected jobs-related data released in the past week. Moreover, both “soft” (surveys, for instance) and “hard” (actual economic activity) data points have softened. In turn, the 5-year swap has retreated ~24 bps since the end of April. While perhaps this index signals a moderation in data strength and a “topping out” zone for rates, it should be noted that it is a measure of data vs. market consensus expectations; in other words, part of the reason for its recent decline has been attributable to economists having adjusted their forecasts higher.
FHLBNY Advance Rates Observations
Front-End Rates
- Short-end rates, week-over-week, were unchanged to a bp lower in the 4-month-and-in sector and then two bps lower in the 5- and 6-month tenors, with the modest changes being driven by the market’s pricing of rate policy direction. Short-end markets will remain most influenced by data and the market’s pricing of the Fed.
- In the forthcoming week, market focus will center on the inflation data releases and Fedspeak.
Term Rates
- The longer-term curve, week-on-week and generally mirroring moves in USTs and swaps, moved lower and flatter. While the 2-year fell by ~9 bps, the 5-year declined by ~11 and the 10-year by ~13 bps. Please refer to the previous section for color on the changes.
- On the UST term supply front, the upcoming week serves as a reprieve from auctions. Note that UST auctions usually occur at 1pm and can occasionally spur volatility around that time. Please contact the Member Services Desk for further information on market dynamics, rate levels, or products.
The FHLBNY is pleased to announce the 2024 0% Development Advance (ZDA) Program, now available with a new streamlined submission process. This program provides members with subsidized funding in the form of interest rate credits to assist in originating loans or purchasing loans/investments that meet the eligibility criteria under the Business Development Advance (BDA), Climate Development Advance (CDA), Infrastructure Development Advance (IDA), or Tribal Development Advance (TDA). Please contact the Member Service Desk for information and/or visit our ZDA information page.
Price Incentives for Advances Executed Before Noon: In effect as of Tuesday, September 5, 2023, the FHLBNY is pleased to now offer price incentives for advances executed before Noon each business day. These pricing incentives offer an opportunity to provide economic value to our members, while improving cash and liquidity management for the FHLBNY. For further details, kindly refer to the Bulletin.
The Symmetrical Prepayment Advance Feature
For those anticipating term funding needs, and with rates on an uptrend, it can be an appropriate juncture to consider our SPA feature. This feature allows the member to capture, at prepayment, changes in the fair value of the advance which are favorable to the member. Contact Member Services Desk to discuss.
Looking for more information on the above topics? We’d love to speak with you!
Questions?
If you wish to receive the MSD Weekly Market Update in .pdf format (includes FHLBNY rate charts) or to discuss this content further, please email the MSD Team.