Member Services Desk
Weekly Market Update
This MSD Weekly Market Update reflects information for the week ending May 3, 2024.
Economist Views
Click to expand the below image.
Please note that this report and all levels referred to herein were produced prior to the Friday, May 3 employment situation report, which may move markets. Kindly call the Member Services Desk for any updates.
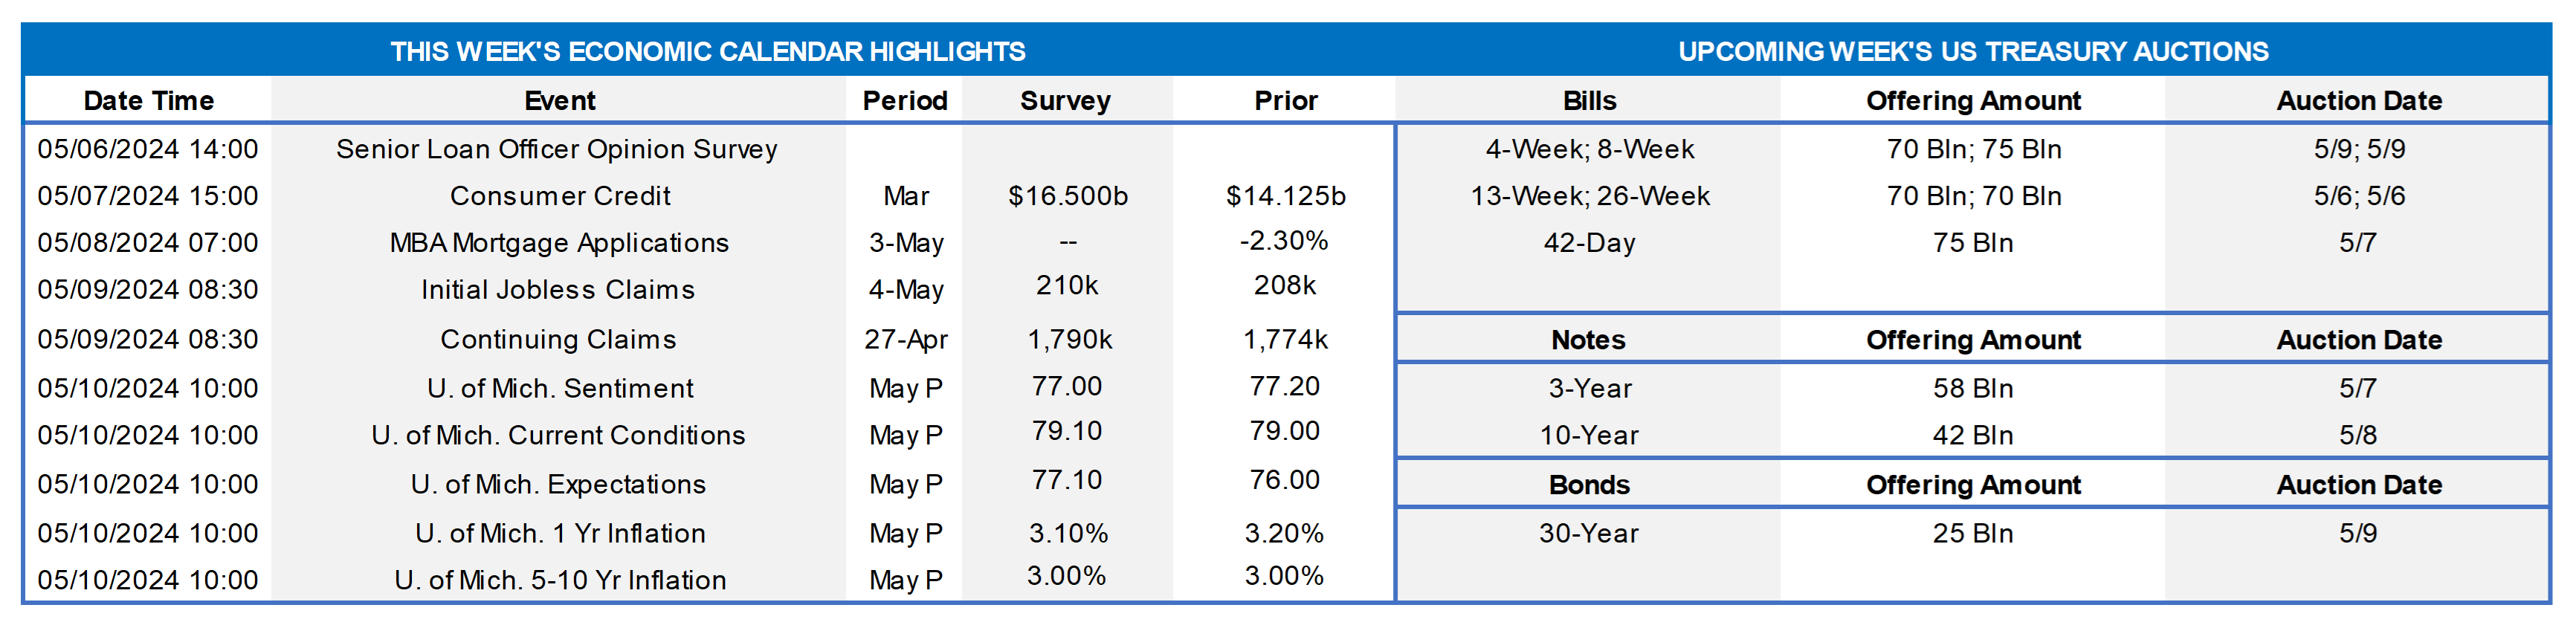
Having weathered the latest Federal Open Market Committee meeting and the Bureau of Labor Statistics’ update on the employment situation in April, market participants will face an extremely quiet economic release calendar this upcoming week. Jobless claims likely remained rangebound in their latest reporting periods, while consumer confidence ebbed in early May. A quartet of Federal Reserve officials will make public appearances. The April 2024 Senior Loan Officer Opinion Survey on Bank Lending Practices will provide an important update on changes in the standards and terms on, as well as demand for, commercial bank loans to businesses and households.
Consumer Credit: Consumer installment credit probably expanded by $15bn in March after a $14.1bn takedown in February.
Jobless Claims: Initial claims for unemployment insurance benefits likely remained in a range of 205-225K during the filing period ended May 4. Continuing claims – the total number of persons collecting benefits – probably registered slightly below the 1.8mn mark during the week ended April 27 – a sign that the recently unemployed are having little trouble finding work.
University of Michigan Consumer Sentiment: Consumers’ appraisals of current and prospective economic conditions probably deteriorated during the early part of May, thereby placing this confidence gauge at a five-month low of 76.
Federal Reserve Appearances:
- May 6 NY Fed President Williams to participate in a fireside chat conversation at the Milken Institute Global Conference.
- May 6 Federal Reserve Board to release Senior Loan Officer Opinion Survey on Bank Lending Practices.
- May 7 Minneapolis Fed President Kashkari to participate in a fireside chat at the Milken Institute Global Conference.
- May 8 Fed Governor Cook to discuss the latest Semi-Annual Financial Stability Report at an event hosted by Brookings.
- May 10 Chicago Fed President Goolsbee to speaks at a moderated Q&A at the Economic Club of Minnesota.
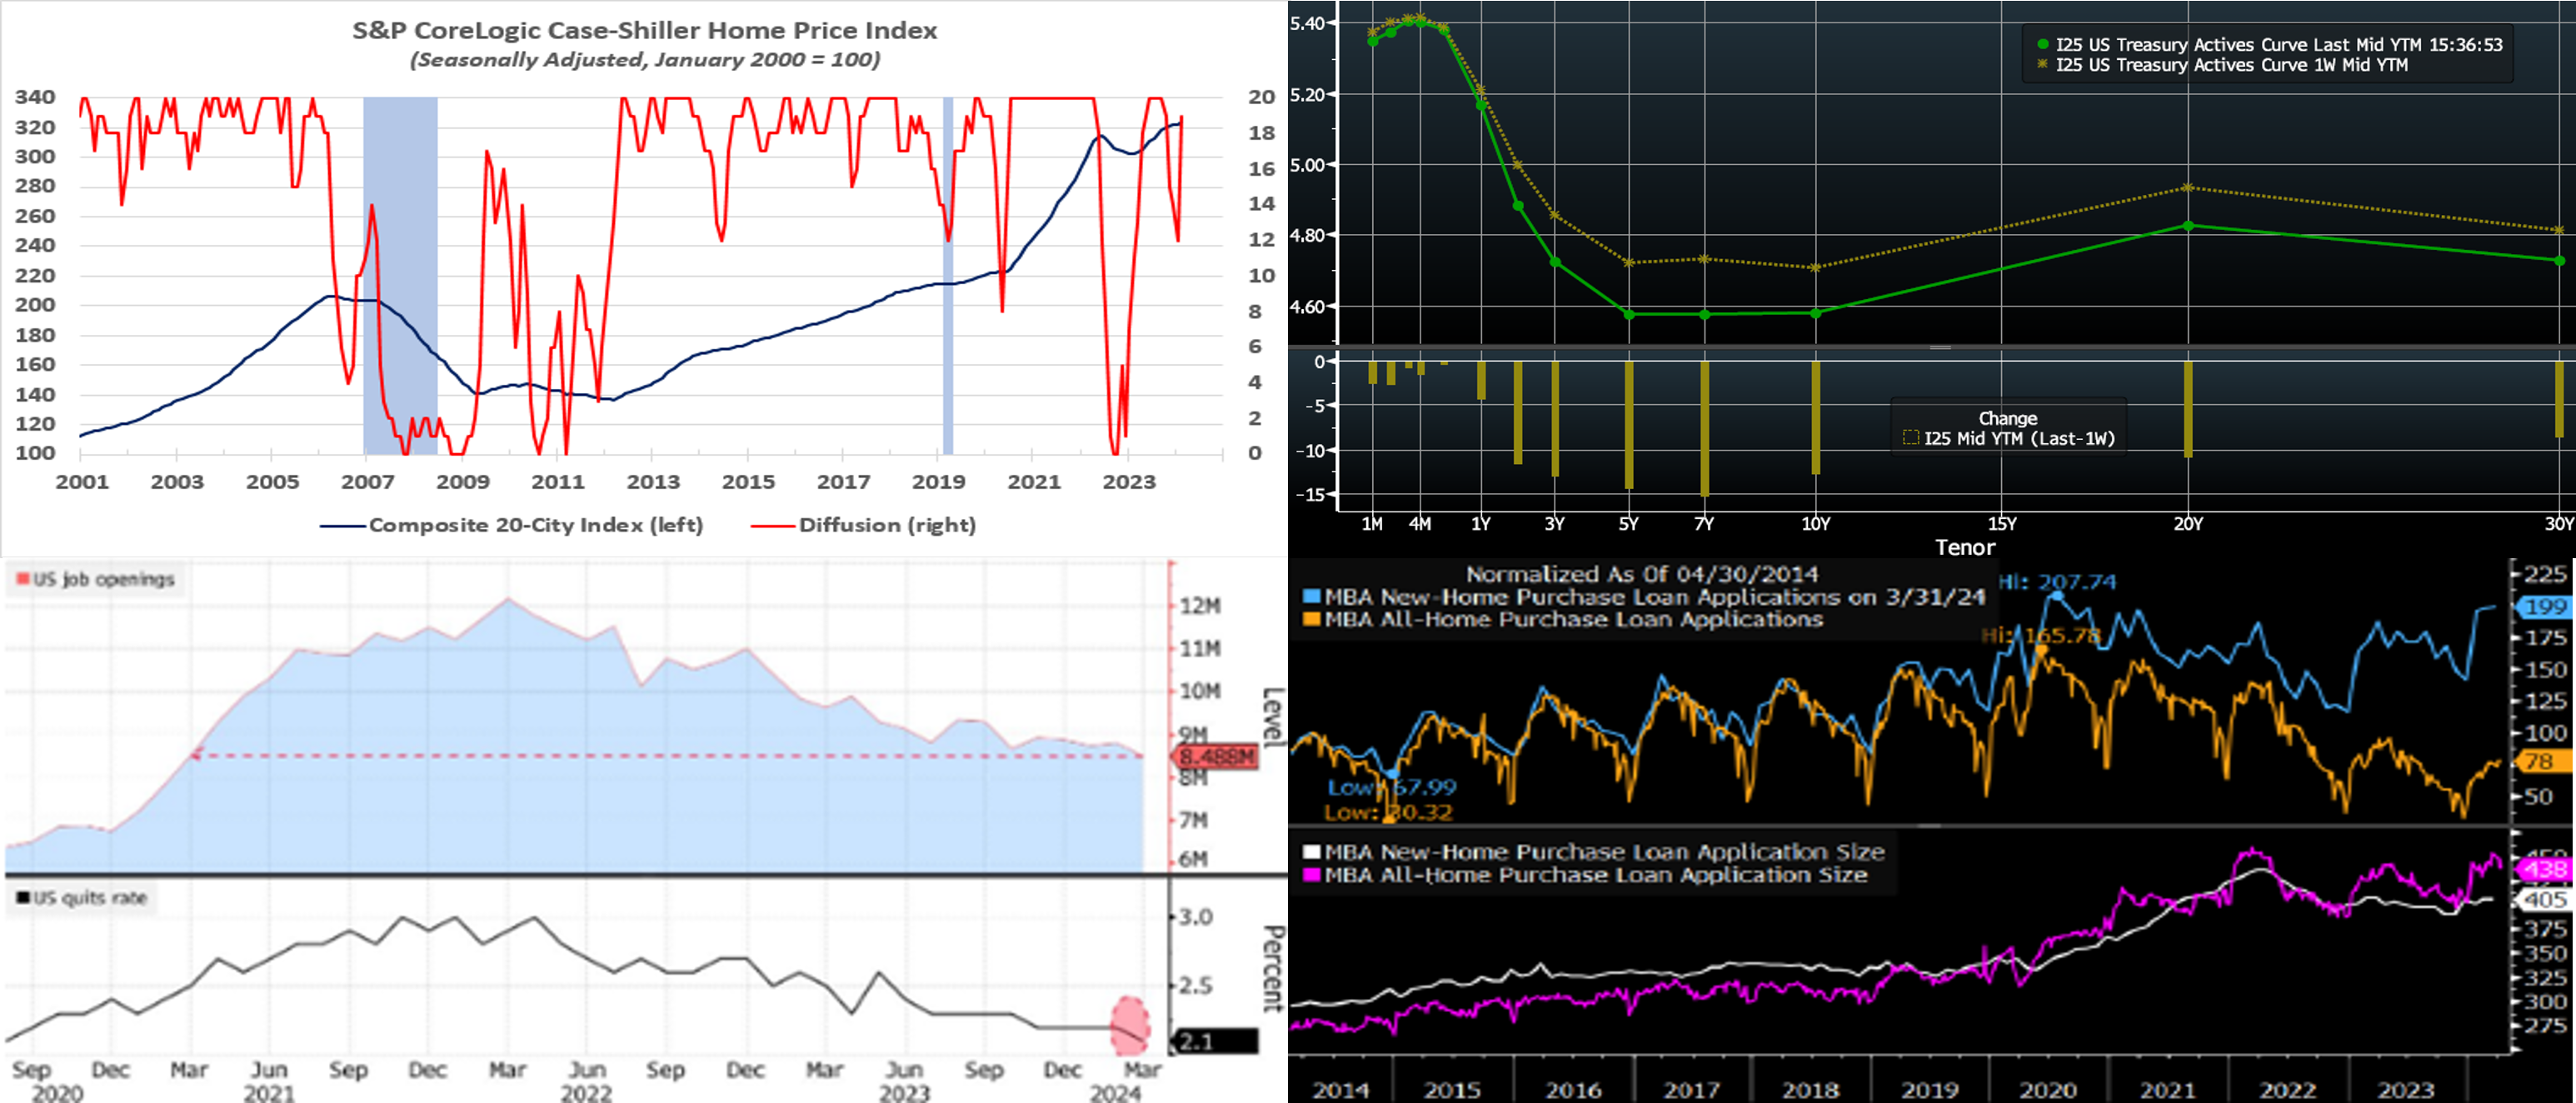
CHART 1 UPPER LEFT
Source: S&P CoreLogic Case-Shiller (SPCLCS); FHLB-NY. Note: Blue-shaded areas denote recessions. Home-price increases gathered steam in February. Indeed, the SPCLCS 20-City home price index jumped by .6% during the reference period, besting the median Street call for a .1% uptick by a wide margin and marking the largest rise since last October. Nineteen of the 20 metro areas witnessed higher selling prices in February – the healthiest breadth in four months. Last month’s rise left home prices a hefty 7.3% above those posted in February 2023. Closer to home, the NYC metro area enjoyed a 1% gain, placing selling prices 8.7% above those recorded 12 months ago. After adjusting for a modest uptick in local inflation, real home prices climbed by .9% in February and stood 7.1% above those of a year ago.
CHART 2 UPPER RIGHT
Source: Bloomberg. Top pane is yield (LHS, %), bottom pane is change (LHS, bps). From last Thursday afternoon to this one, the UST curve moved lower, led by the 5- to 7-year zone. Yields were lower by ~10 to 15 bps across the curve, with the changes occurring post-FOMC on Thursday. The market appears to be relieved that the Fed expressed confidence in its patient stance on completing its mission of getting inflation down to the 2% target. Also helping yields move lower was the Fed’s announcement to taper the reduction of its bond holdings. In terms of market-implied pricing of the Fed, a full 100% probability of a 25 bps cut has now been pushed a tad earlier to November from December, with the June 13th FOMC priced at only ~9% chance, up from ~2% last week. The August 1st FOMC is priced at ~33%, up from 30% last week, chance of the first 25 bps cut. The year-end 2024 forward is 4.945%, or 5 bps lower than last week, implying a cumulative total of 38.5 bps of cuts by the end of this year.
CHART 3 LOWER LEFT
Source: Bloomberg; Bureau of Labor Statistics (BLS). Clearly, due to the preceding years of lower rates, the transmission mechanism of Fed hikes impacting the economy and pinning inflation embers to the proverbial wrestling mat has and will take time. Perhaps offering the Fed a ray of hope on this front was Wednesday’s BLS’ Job Openings and Labor Turnover Survey, known as JOLTS. Indeed, Fed Chair Powell cited the report in his post-FOMC press conference. Available positions (RHS) decreased to 8.49mn from an upwardly revised 8.81mn reading in the prior month. This result represents the type of cooling that is welcome to the Fed, with demand for workers slowing through fewer openings rather than outright job losses. Moreover, the ratio of openings to unemployed people dropped to 1.3, matching the lowest since August 2021. The figure — which Fed officials pay close attention to — has eased substantially over the past year. At its peak in 2022, the ratio was 2 to 1. Also, the quits rate (RHS) dipped. It should be noted, however, that this report is a survey and can suffer from typical survey deficiencies, such as low response rate. Other job market indicators, such as temporary positions, have also reflected an easing jobs market. Note that our Weekly is being prepared before the May 3 employment report, and further light will be shed on this topic from this tier-1 release.
CHART 4 LOWER RIGHT
Source: Bloomberg Intelligence; Mortgage Bankers Association. Here can be seen a bright spot in the housing market, namely that the New-Home-Mortgage Loan index is at its highest since 2020 and near its peak of the last decade. This trend stands in sharp contrast to total purchase-loan applications which are languishing just above decade lows. New-home purchase-loan sizes have recently trended below those for average purchases, in a sign that the new-home sector offers better affordability than the supply-constrained existing home sector.
FHLBNY Advance Rates Observations
Front-End Rates
- Short-end rates moved modestly week-over-week, with 2-month-and-in unchanged but 3-month-and-out tenors two bps lower. With the Fed portfolio’s monthly UST runoff caps now lowered, per the FOMC announcement this past Wednesday, reduced pressures in the short-term funding markets should result, especially surrounding month and quarter-ends, on the margin and all else equal. But short-end markets will remain most influenced by data and the market’s pricing of the Fed.
- In a forthcoming light data week, market focus will steer towards Fedspeak.
Term Rates
- The longer-term curve, week-on-week and generally mirroring moves in USTs and swaps, moved lower by 7 to 13 bps, led by the 4- to 10-year sector. Please refer to the previous section for color on the changes.
- On the UST term supply front, the upcoming week serves a heavy slate of 3/10/30-year auctions. Note that UST auctions usually occur at 1pm and can occasionally spur volatility around that time. Please contact the Member Services Desk for further information on market dynamics, rate levels, or products.
The FHLBNY is pleased to announce the 2024 0% Development Advance (ZDA) Program, now available with a new streamlined submission process. This program provides members with subsidized funding in the form of interest rate credits to assist in originating loans or purchasing loans/investments that meet the eligibility criteria under the Business Development Advance (BDA), Climate Development Advance (CDA), Infrastructure Development Advance (IDA), or Tribal Development Advance (TDA). Please contact the Member Service Desk for information and/or visit our ZDA information page.
Price Incentives for Advances Executed Before Noon: In effect as of Tuesday, September 5, 2023, the FHLBNY is pleased to now offer price incentives for advances executed before Noon each business day. These pricing incentives offer an opportunity to provide economic value to our members, while improving cash and liquidity management for the FHLBNY. For further details, kindly refer to the Bulletin.
The Symmetrical Prepayment Advance Feature
For those anticipating term funding needs, and with rates on an uptrend, it can be an appropriate juncture to consider our SPA feature. This feature allows the member to capture, at prepayment, changes in the fair value of the advance which are favorable to the member. Contact Member Services Desk to discuss.
Looking for more information on the above topics? We’d love to speak with you!
Questions?
If you wish to receive the MSD Weekly Market Update in .pdf format (includes FHLBNY rate charts) or to discuss this content further, please email the MSD Team.