Member Services Desk
Weekly Market Update
This MSD Weekly Market Update reflects information for the week ending April 18, 2025.
Economist Views
Click to expand the below image.
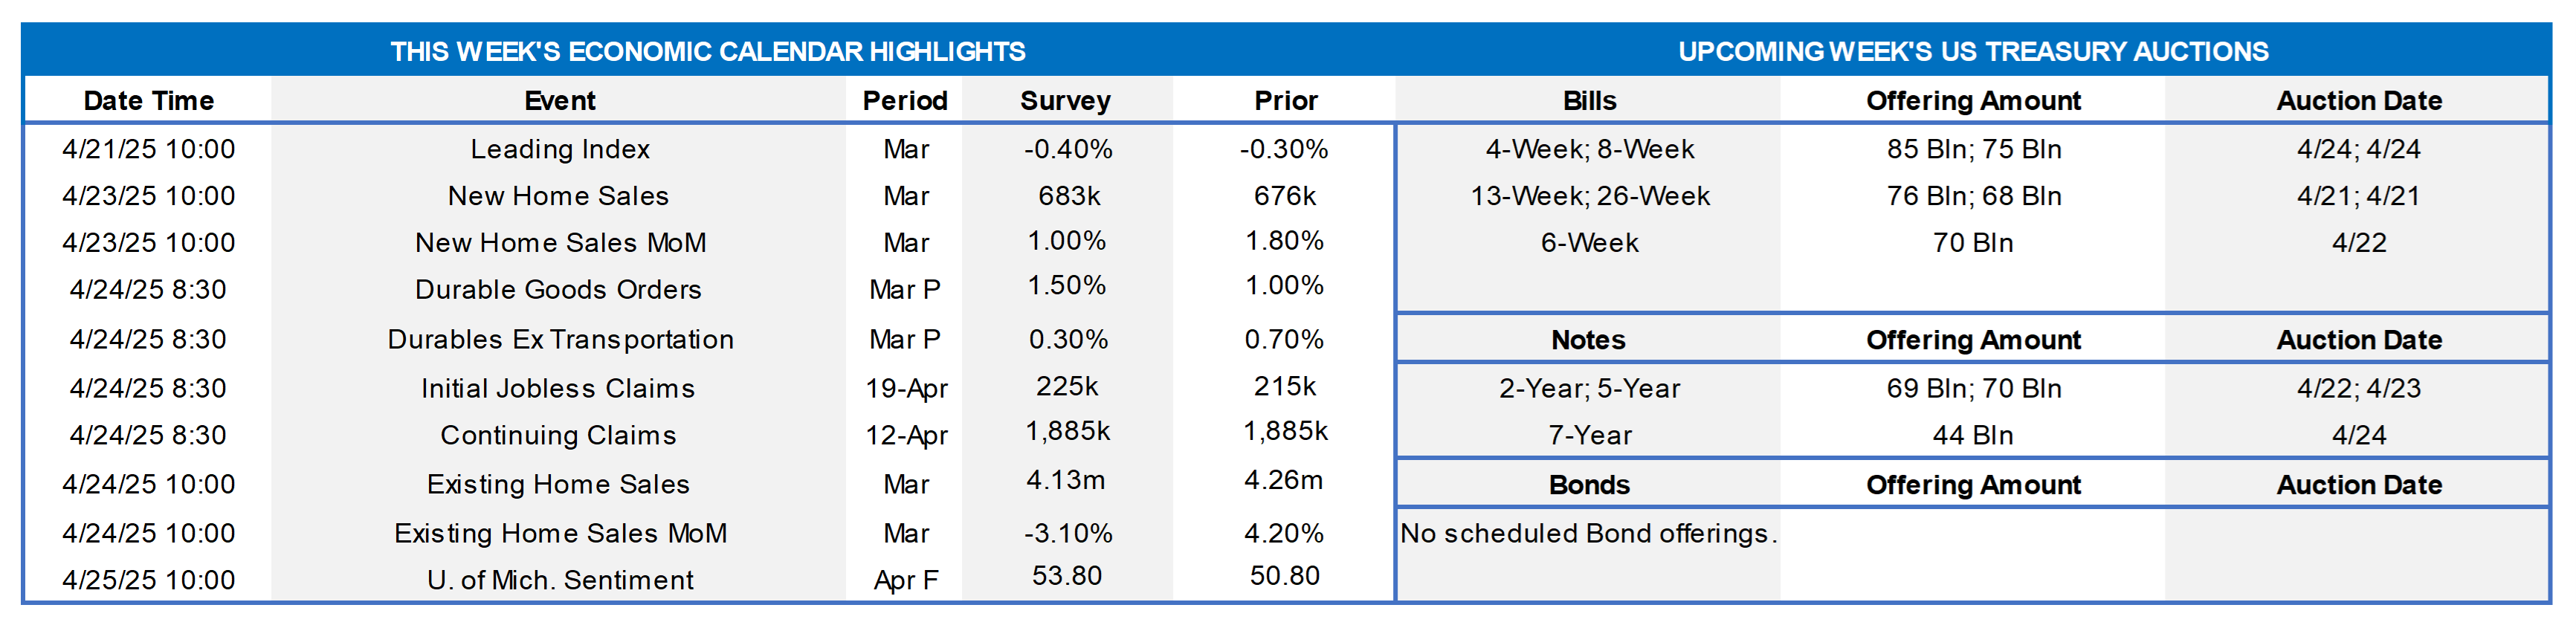
Market participants will face a calendar of mixed economic releases this coming week. Both new and existing home sales are expected to have retreated from their reported February levels. Commercial aircraft bookings likely fueled the largest increase in durable goods bookings since last July. Weekly unemployment insurance figures probably remained solid, hinting at a 150K increase in nonfarm payrolls and no change in the unemployment rate from 4.2% in the Bureau of Labor Statistics March report. Consumer confidence likely ebbed further over the latter half of April, with a risk that the University of Michigan’s index slipped to a record low. Half a dozen Federal Reserve officials, including a trio of current FOMC voters, will make public appearances.
New Home Sales: Echoing reported pullbacks in single-family housing starts and building permits, contracts to buy a newly constructed dwelling probably tumbled by 9% to a 16-month low seasonally adjusted annual rate of 615K in March.
Durable Goods Orders: Powered by a commercial jetliner-led surge in transportation equipment requisitions, durable goods orders probably jumped by 3.9% in March, boosting the cumulative rise since the end of last year to 8.5%. Net of an anticipated 11% leap in transport bookings, “hard” goods orders likely edged .3% higher during the reference period, after a .7% prior-month increase. As always, pay attention to nondefense capital goods shipments less aircraft for clues to the pace of business equipment spending during the winter quarter.
Jobless Claims: Despite concerns of an imminent deterioration, labor market conditions probably were little changed during the filing period ending April 19, with initial claims for unemployment insurance benefits remaining in a historically low 215K-230K range. The total number of persons receiving regular state benefits probably registered below 1.9mn, once again during the week ended April 12, implying that recent job-losers can find work. Keep an eye on separate federal worker figures for signs that layoffs announced by the Department of Government Efficiency have taken place.
Existing Home Sales: Weaker home-purchase contract signings over the January-February span suggest that existing home sales likely dipped by .7% to a seasonally adjusted annual rate of 4.23mn in March, reversing a portion of the surprising 4.2% prior-month jump. With the number of available homes on the market expected to jump by 4.7% to a four-month high 1.34mn on a not seasonally adjusted basis during the reference period, the supply at the estimated sales pace would move two ticks higher to 3.7 months.
Michigan Sentiment Index: Adversely impacted by inflation concerns and recession fears, consumer confidence probably eroded further during the latter part of April, leaving the University of Michigan’s sentiment gauge at an all-time low of 49.
Federal Reserve Appearances:
- Apr. 21 Chicago Fed President Austan Goolsbee to appear on CNBC.
- Apr. 22 Federal Reserve Governor Jefferson to give keynote remarks at the Philadelphia Fed Economic Mobility Summit.
- Apr. 22 Philadelphia Fed President Harker to speak about how economic mobility impacts regional economies.
- Apr. 22 Minneapolis Fed President Kashkari to speak at the US Chamber of Commerce Global Summit in Washington DC.
- Apr. 23 St. Louis Fed President Musalem and Fed Governor Waller to give opening remarks at a Fed Listens event.
- Apr. 23 Cleveland Fed President Beth Hammack to speak to the Money Marketeers in New York.
- Apr. 23 Federal Reserve to release Beige Book summary of economic conditions.
- Apr. 24 Minneapolis Fed President Kashkari to speak at the University of Minnesota College of Science and Engineering.
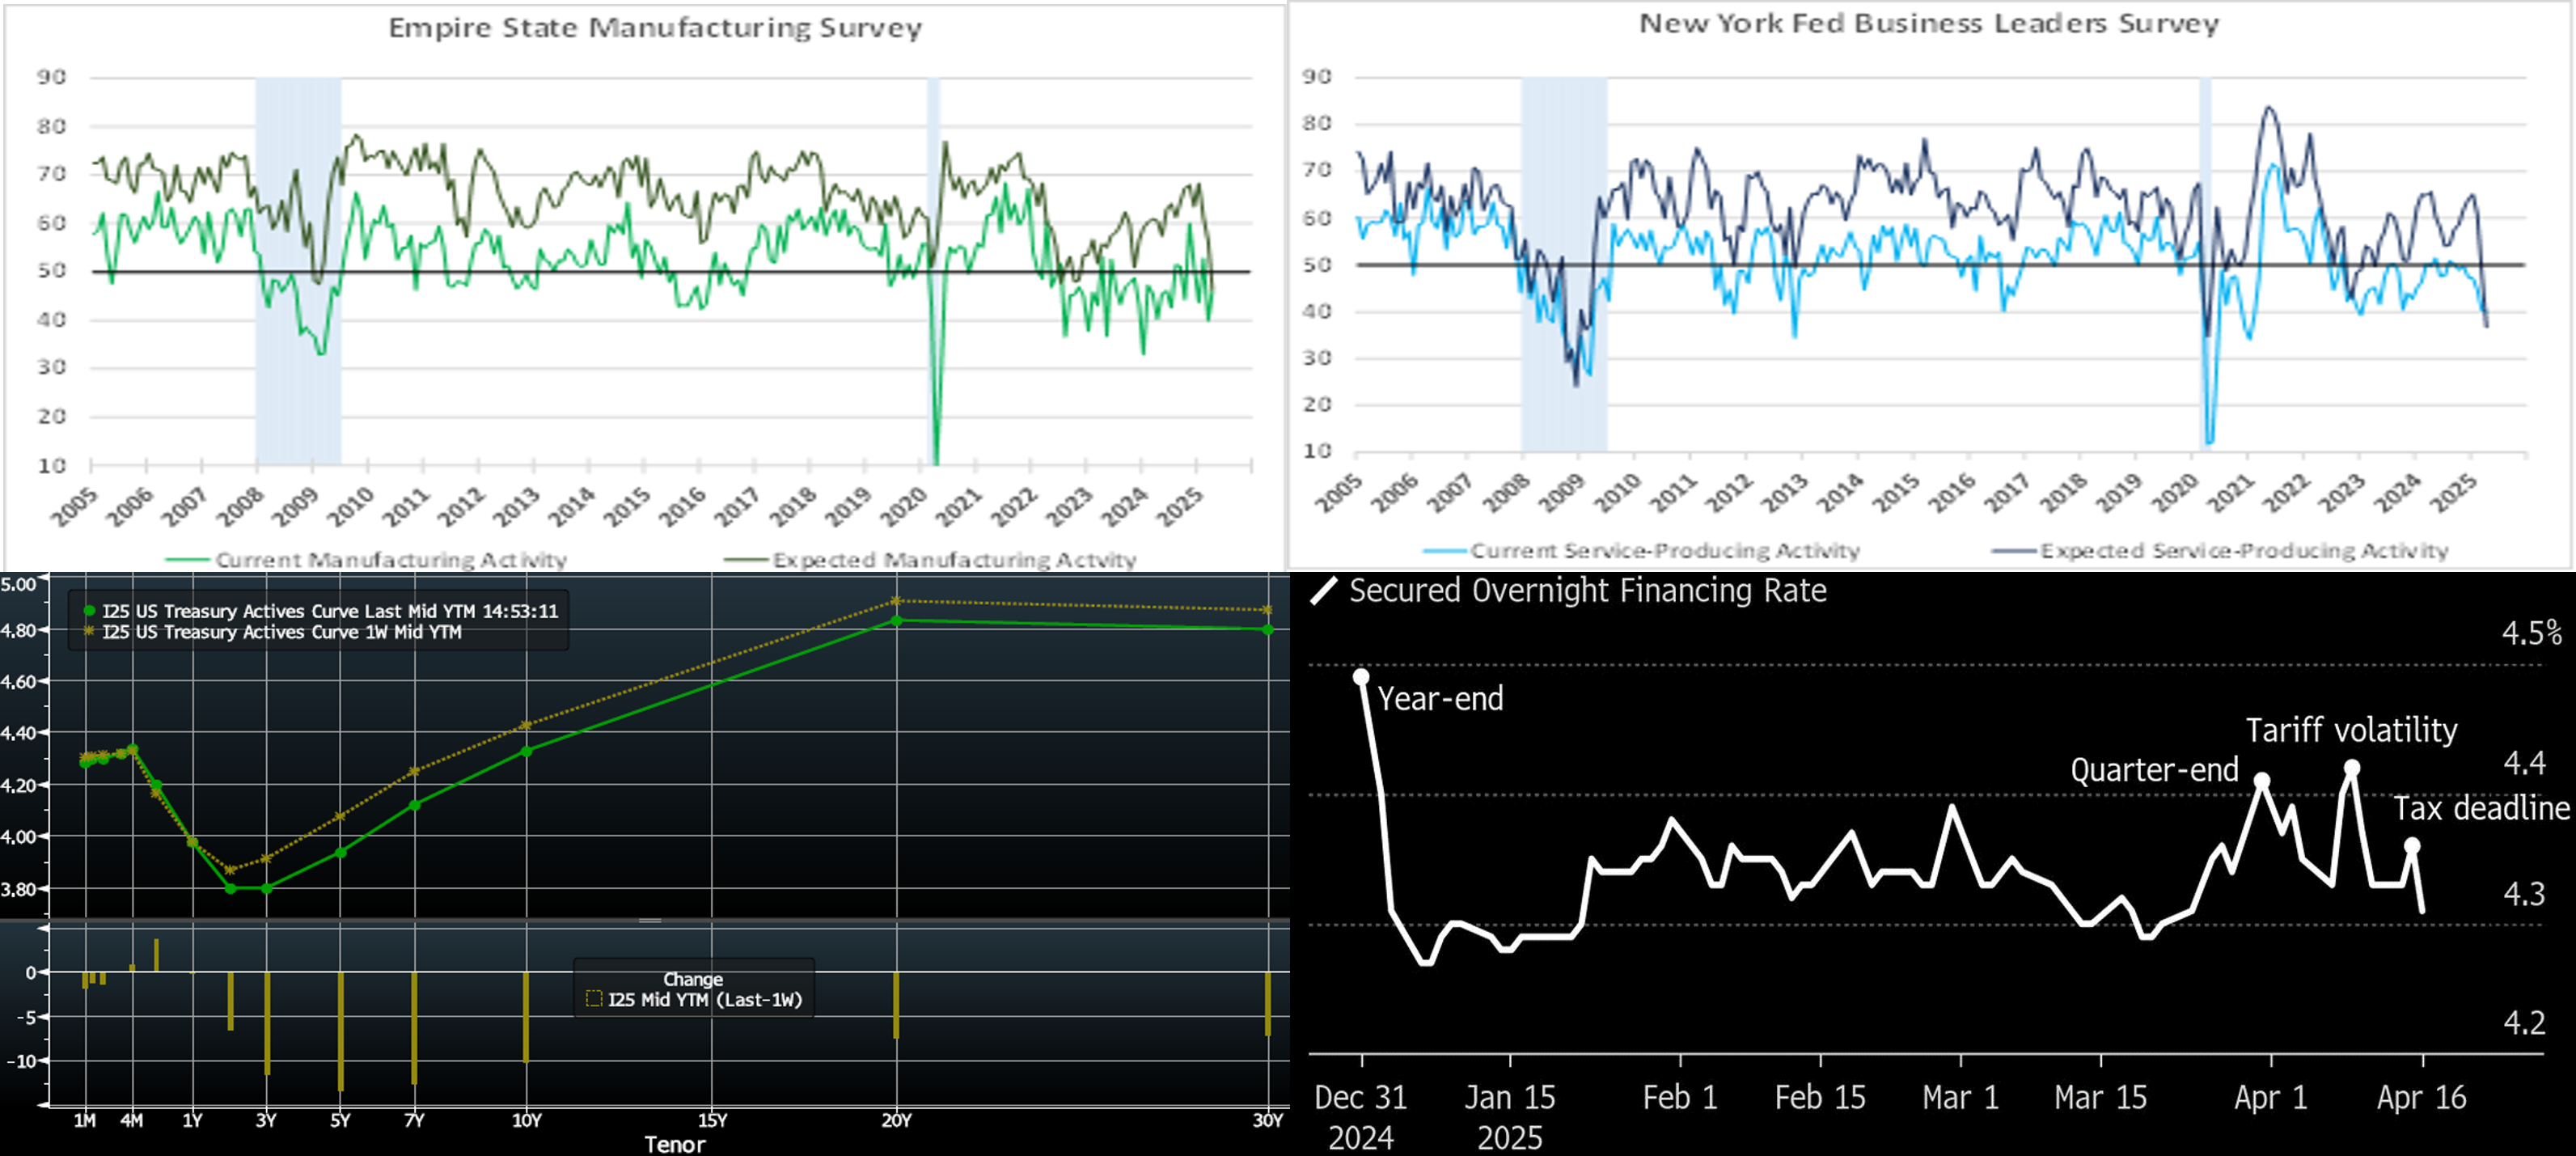
CHART 1 UPPER LEFT and CHART 2 UPPER RIGHT
Source: Federal Reserve Bank of New York; National Bureau of Economic Research; FHLB-NY. Note: Diffusion indexes equal the percentage of respondents experiencing an increase in activity plus one-half of those witnessing no change. Reflected in data released this past week, business activity contracted across much of the FHLB-NY coverage area in early April. While our barometer of current manufacturing activity (LHS) climbed by six points to 46 during the reference period, it remained below the 50-point mark associated with no change in conditions. Meanwhile, the contraction in service-producing activity (RHS) across New York, northern New Jersey, and southwestern Connecticut that began last October quickened pace, with our barometer dipping from 40.4 to 40.1 – the weakest showing since January 2023. Of even more concern, however, are the accelerated erosions of firms’ expectations six months hence. Manufacturers’ expectations tumbled by 10.1 points to 46.3 in early April – the most pessimistic sounding since September 2001 – while anticipated service-producing activity plunged by 11.7 points to 36.7, just a touch above the low plumbed at the depths of the COVID-19 pandemic. Also of note is that an index of current prices paid for materials increased nearly 6 points to 50.8, the highest since August 2022, while a gauge of prices received by manufacturers in NY also rose to a more than two-year high. These figures, in addition to increases in price expectations, signal that higher tariffs are contributing to inflationary pressures.
CHART 3 LOWER LEFT
Source: Bloomberg. Top pane is yield (LHS, %); bottom pane is change (LHS, bps). At Thursday’s early market close, the UST term curve was lower vs. the week prior, led by the belly of the curve. The 2, 5, and 10-year declined by, respectively, 6, 12, and 10 bps. The tariff-induced liquidation in stocks, bonds, and credit has calmed notably, although financial condition metrics remain tighter than prior to the April 4th “tariff day”. Weaker-than-expected economic data also helped yields edge lower. As of Thursday’s close, the market prices end-2025 fed funds ~3.48%, or 4 bps higher than a week ago which equates to ~3.4 25-bps Fed cuts. The market’s end-2026 forward is ~3.12%, or 7 bps lower than a week ago.
CHART 4 LOWER RIGHT
Source: Bloomberg. Here lies some explanation for the recent volatility in our shortest (1-month-and-in) maturity advance tenors. Portrayed here is the trend of SOFR amidst recent market dynamics, and its up-and-down moves have, in turn, impacted our rate levels. Per usual, there was upward pressure at quarter-end, as Street dealer balance sheets tend to pare back and repo rates edge higher. Meanwhile, UST auction settlements at March month-end also exerted upward pressure on repo rates, as cash was withdrawn from the markets and/or buyers needed financing. After initially subsiding post-quarter end, the tariff developments exerted fresh upward pressure on repo rates from liquidation in UST’s and general market wariness. Credit spreads also widened and steepened in this period, thereby further pressuring short-end rates higher. Consistent with the April 15th tax date that can typically spur upward pressure on short-end rates via funds leaving the markets and financial system, this past week’s tax date spurred a mid-week increase in SOFR, as reflected in the April 15 activity-date SOFR of 4.36%. As the holiday-shortened week approached a close, market volatility had notably tempered, and SOFR had retreated to just above mid-March levels. Nonetheless, potential volatility still lurks, and there is a fresh round of UST supply settling at month-end.
FHLBNY Advance Rates Observations
Front-End Rates
- As of Thursday afternoon, short-end rates were lower from a week ago, led by the shorter tenors. The 3-month-and-in sector was lower by 4 to 9 bps; the 4- to 6-month sector was 2 to 3 bps lower. The shortest tenors have recently experienced impacts from lingering tighter overnight repo markets as well as some widening of credit spreads amidst the tariff drama. These pressures cooled off this past week, at least for the time being, thereby allowing rates to revert lower. Meanwhile, Tax Day appeared to “come and go” without major disruption, and this week is the typical monthly juncture for the agencies to invest collected funds in the money markets before subsequent MBS payments. Robust Money Market Fund AUM levels have helped underpin demand for short-end paper. Also helpful is that net T-bill supply has been negative in recent weeks, owing to debt ceiling dynamics.
- The market will focus on economic data and further trade policy news in the upcoming week.
Term Rates
- The longer-term curve, generally mirroring moves in USTs and swaps, was lower from the week prior. The 2, 5, and 10-year were lower by, respectively, 5, 9, and 7 bps Kindly refer to the previous section for color on market dynamics and changes. Given the still volatile environment, we encourage members to engage with the Member Services Desk for current rate levels and market dynamics.
- On the UST term supply front, the upcoming week serves 2/5/7-year auctions. Note that UST auctions usually occur at 1pm and can occasionally spur volatility around that time. Please contact the Member Services Desk for further information on market dynamics, rate levels, or products.
Price Incentives for Advances Executed Before Noon: In effect as of Tuesday, September 5, 2023, the FHLBNY is pleased to now offer price incentives for advances executed before Noon each business day. These pricing incentives offer an opportunity to provide economic value to our members, while improving cash and liquidity management for the FHLBNY. For further details, kindly refer to the Bulletin.
Looking for more information on the above topics? We’d love to speak with you!
Archives
Questions?
If you wish to receive the MSD Weekly Market Update in .pdf format (includes FHLBNY rate charts) or to discuss this content further, please email the MSD Team.