Member Services Desk
Weekly Market Update
This MSD Weekly Market Update reflects information for the week ending March 28, 2025.
Economist Views
Click to expand the below image.
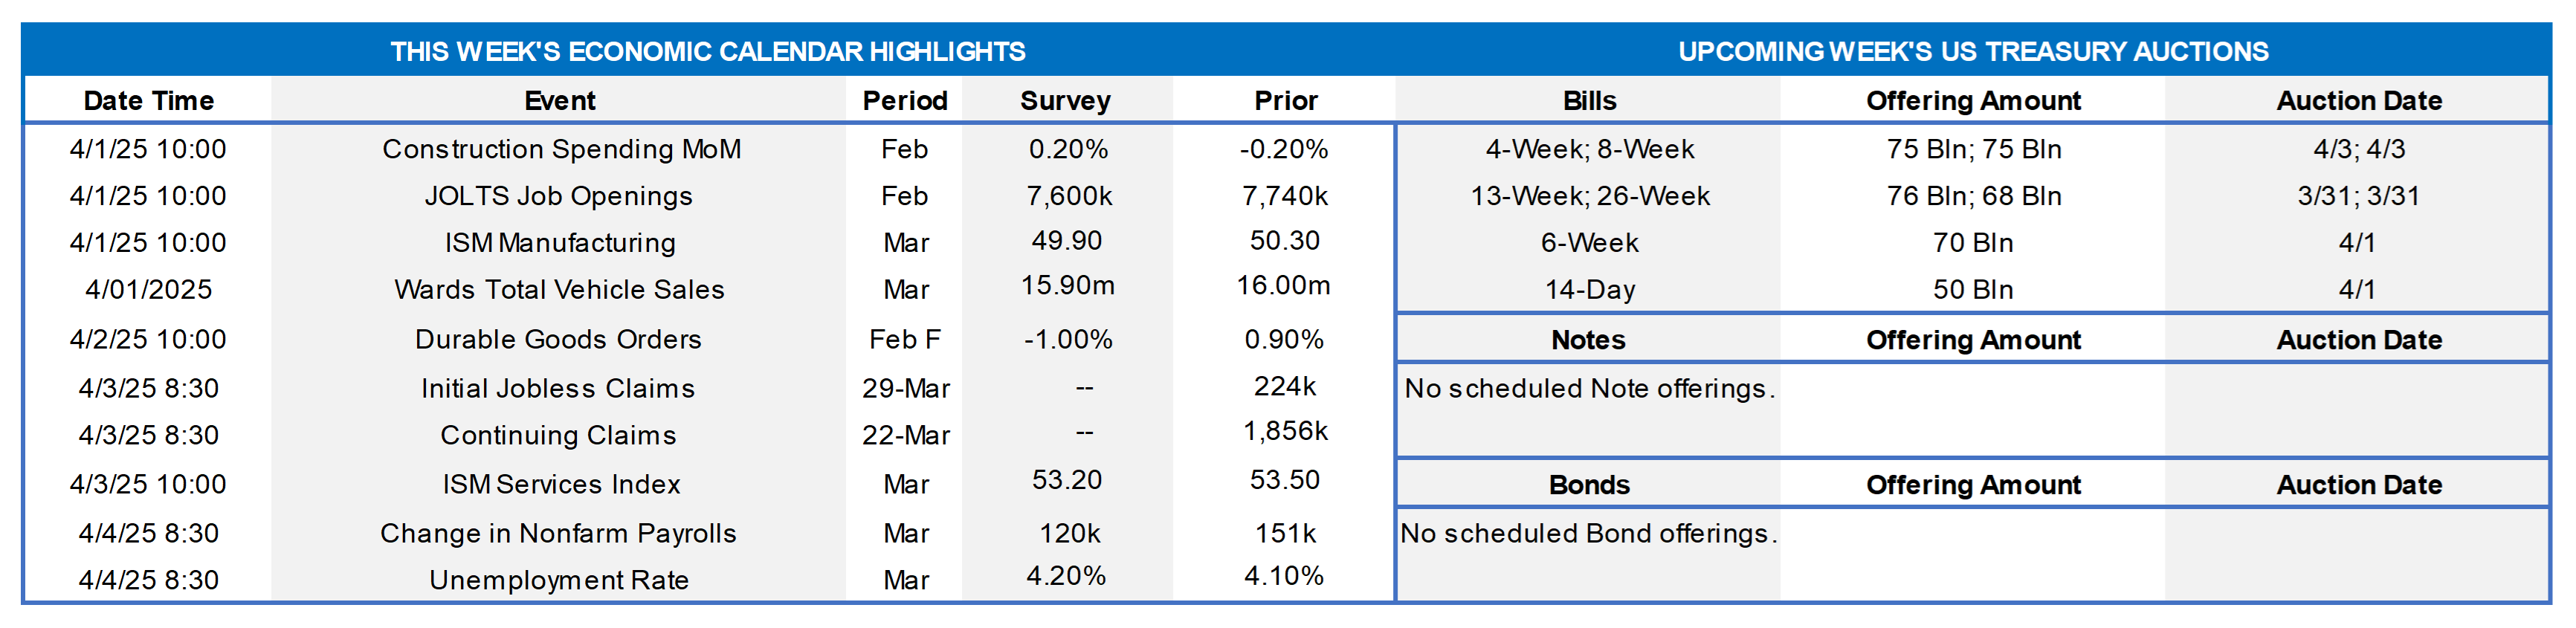
The markets will steer their focus to the labor side of the Federal Reserve’s dual mandate this week when the Bureau of Labor Statistics (BLS) releases its April 4th update on the employment situation for March. Buoyed by a favorable swing in weather conditions between establishment survey canvassing periods, net hiring probably quickened during the reference period, with nonagricultural establishments adding approximately 225K net new jobs, after a 151K increase in January. Weekly jobless claims reports suggest that the civilian unemployment rate held steady at 4.1% in March, leaving the Sahm-Rule recession gauge at 0.23%, further away from the .5% critical value consistent with previous business-cycle turning points. With the BLS’ canvassing period ending precisely on the 15th of the month, an upside surprise on average hourly earnings compared to the Street’s median .3% projection may also be in store. Better climatic conditions during the March survey period likely prompted a six-minute extension of the average private workweek to 34.2 hours. While often overlooked, each tick on the workweek is the equivalent of adding roughly 395K private workers from a labor-input point of view. While results in line with the above projections would undoubtedly push expectations of an impending rate cut further out into the future, other closely followed soundings may not be as encouraging. Indeed, the Institute for Supply Management’s gauge of factory activity probably reverted to contractionary territory in March, while the service-producing barometer declined to its lowest level since last summer. On the lecture circuit, a pair of FOMC voters, including Chair Jerome Powell, are scheduled to make public appearances.
Construction Spending: The nominal value of new construction put-in-place probably rebounded in February, rising by .5% and erasing the .2% dip witnessed in January.
JOLTS Job Openings: A reported increase in online help-wanted postings suggests that nationwide job openings climbed by 260K to a three-month high of 8mn in February. At an estimated 950K during the reference period, the excess of vacant positions nationwide would represent 1.13 jobs per unemployed person.
ISM Manufacturing Activity Index: Available manufacturing canvasses suggest that the Institute for Supply Management’s closely followed gauge fell back into contractionary territory in March, with the Purchasing Managers Index clocking at a five-month low of 47.5%.
Motor Vehicle Sales: Buoyed by sales incentives, purchases of cars and light trucks are expected to edge 1.2% higher to a three-month high seasonally adjusted annual rate of 16.2mn in March.
Factory Orders: A tug of war between stepped-up durable goods requisitions and modestly lower nondurables bookings probably left orders .4% higher in February, after a likely revised 1.8% gain in the prior month.
ISM Service-Producing Activity Index: The expansion in activity probably narrowed further in March, with the Institute for Supply Management’s barometer retreating to a seven-month low of 52.0% from 53.5% in February.
Employment Situation Report: Refer to the color above.
Federal Reserve Appearances:
- Apr. 3 Federal Reserve Vice Chair Jefferson to speak on “Central Bank Communication and Textual Analysis Techniques.”
- Apr. 4 Federal Reserve Chair Jerome Powell to speak with journalists at the SABEW conference in Arlington, Virginia.
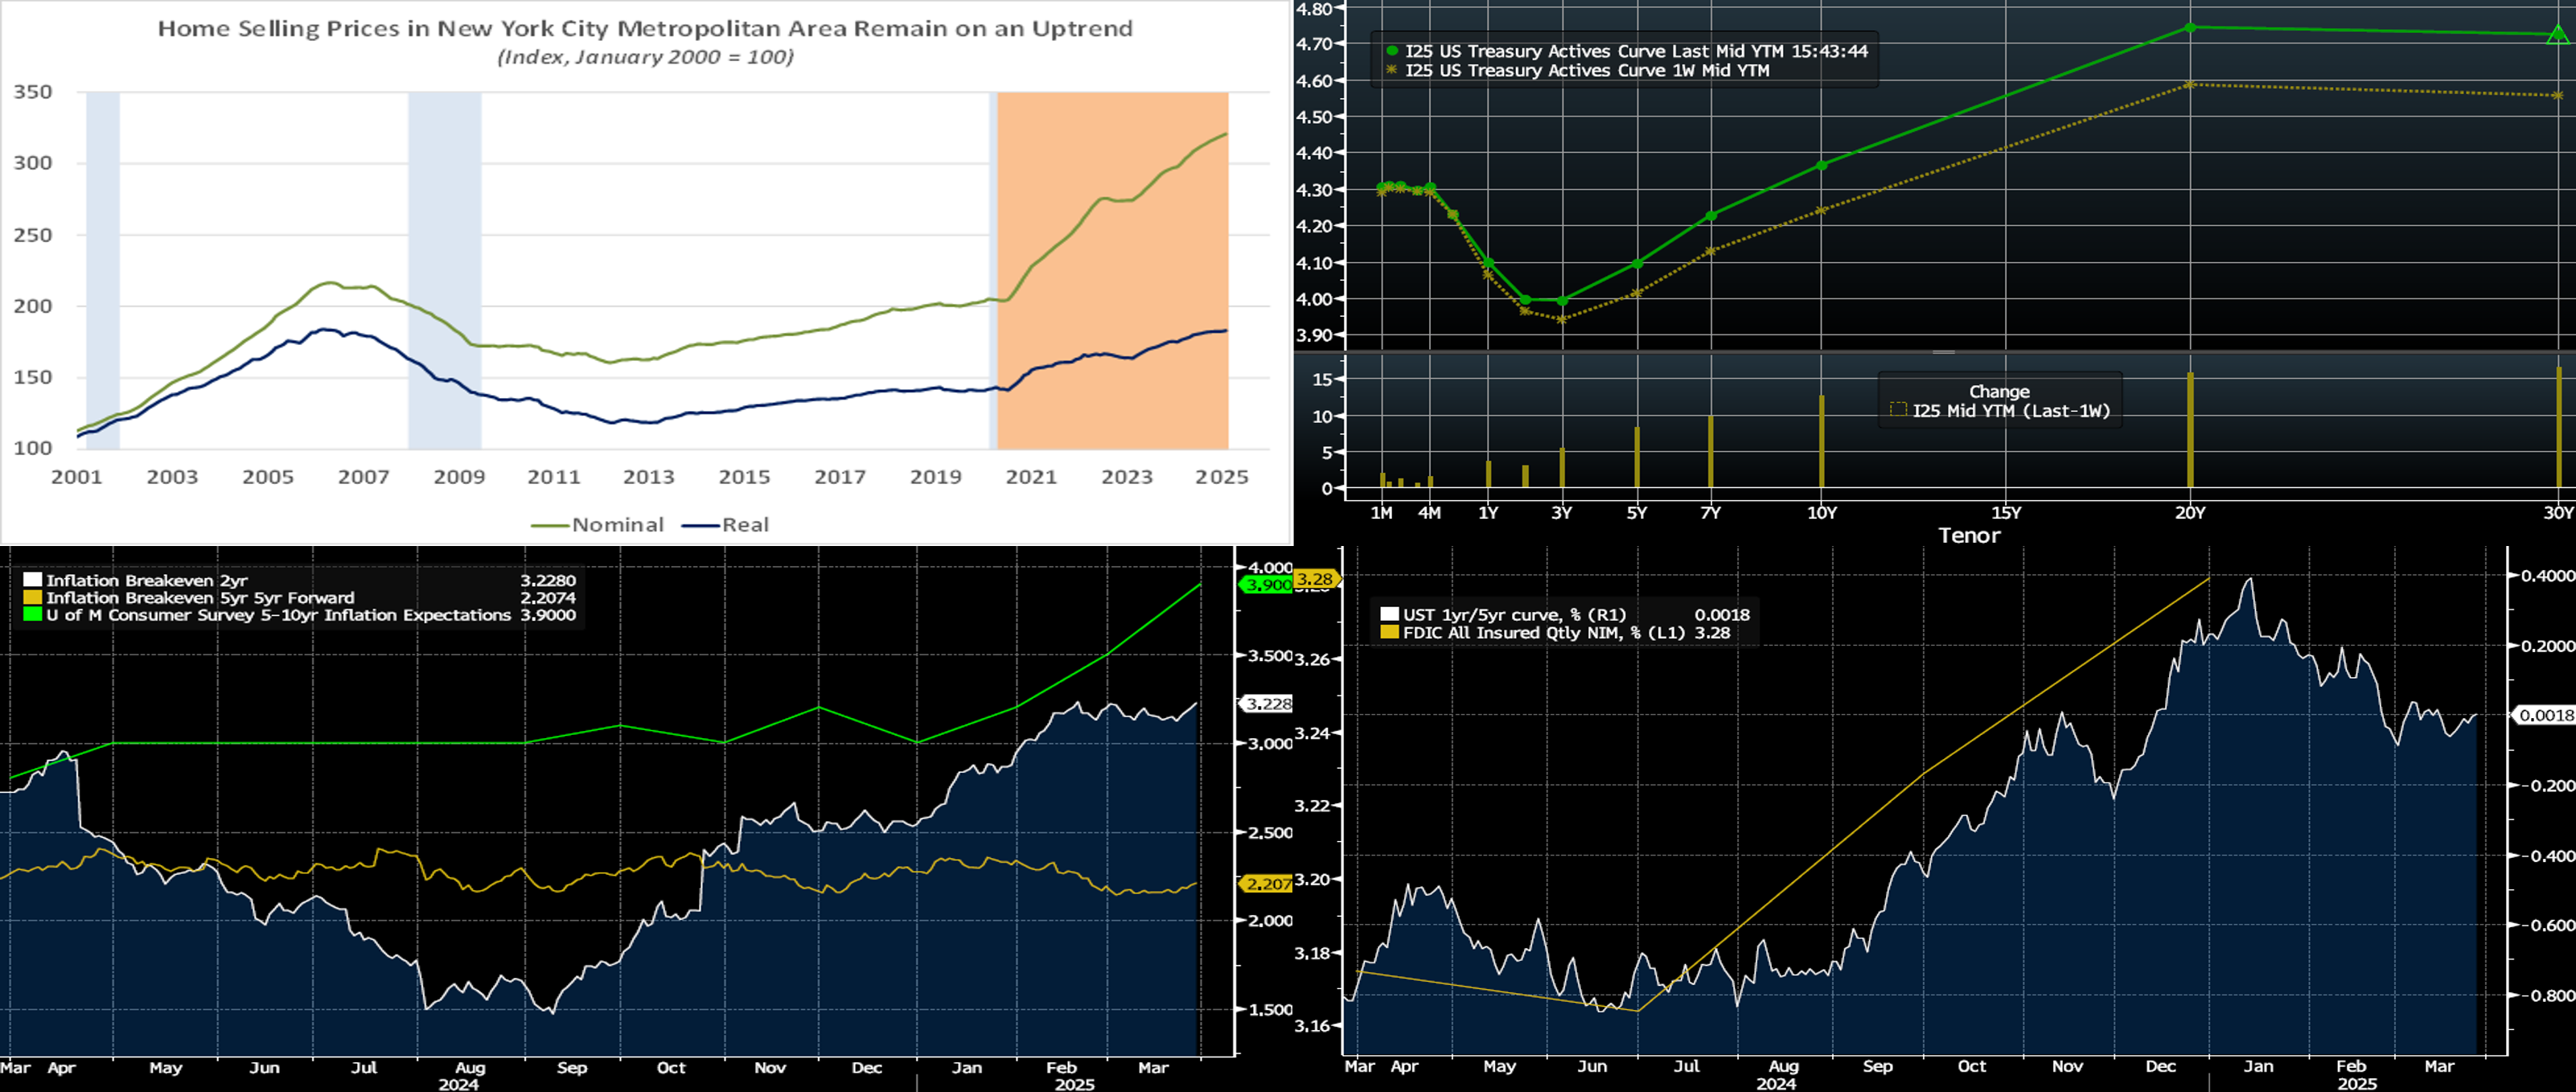
CHART 1 UPPER LEFT
Source: Bureau of Labor Statistics; National Bureau of Economic Research; S&P CoreLogic Case-Shiller; FHLB-NY. Notes: Blue-shaded areas denote recessions; orange-shaded area highlights the current economic expansion. Home selling prices remained on an uptrend across the NYC metro area at the beginning of 2025. S&P CoreLogic Case-Shiller (SPCLCS) reported that local home prices rose by .6% to a record 320.8 (January 2000 = 100) in January, boosting the cumulative increase since February 2023 to 17%. At 7.8%, the rise in local home prices over the last 12 months was the largest among the 20 major metropolitan areas canvassed by SPCLCS and eclipsed the 4.7% average by a wide margin. After adjusting for consumer prices, excluding shelter costs, the picture, although positive, is less steamy. Real home prices in the NYC area climbed by 0.3% during the reference period and have advanced by 4.6% over the last 12 months. Of note, real home prices in January stood just .5% below the peak posted before the Great Recession in March 2006.
CHART 2 UPPER RIGHT
Source: Bloomberg. Top pane is yield (LHS, %); bottom pane is change (LHS, bps). As of Thursday afternoon, the UST term curve was higher and steeper than the prior week. The 2- to 10-year sector was 5 to 12 bps higher in progressive fashion. Data was mixed, with a weak Consumer Confidence report on Tuesday but a slightly stronger Q4 2024 GDP report on Thursday. As of Thursday afternoon, the market prices end-2025 fed funds ~3.705%, or 5 bps higher than a week ago which equates to ~2.5 25-bps Fed cuts. The market’s end-2026 forward is ~3.47%, or 5 bps higher than a week ago.
CHART 3 LOWER LEFT
Source: Bloomberg. Shown here are inflation measures from different vantage points. At last week’s post-FOMC press conference, Fed Chair Powell indicated that inflation forces have not been quelled in the near term. But he also mentioned comfort on inflation beyond the near-term. Indeed, he somewhat dismissed the heightened readings of recent consumer survey reports; as seen here, the University of Michigan’s latest Survey on 5-10-year Inflation Expectations (Green, RHS, %) surged towards 4%. Powell cited market measures of prospective ongoing inflation pressures as being more benign and specifically cited the market-based 5-year Forward Inflation Breakeven (Gold, RHS, %) derived from Treasury Inflation-Protected Securities. Indeed, this measure has been in a relatively stable zone for some time and is now ~2.20%. Note that the 2-year Inflation Breakeven, at 3.23%, is elevated and well above the Fed’s 2% target; in this regard, the markets and the Fed are in synch that the near-term inflation pressures will abate in due course.
CHART 4 LOWER RIGHT
Source: Bloomberg. Shown here is the 1-year/5-year UST curve (White, RHS, %) and the FDIC’s All-Insured Quarterly Net Interest Margin measure (Gold, LHS, %). NIMs improved in the final quarter of 2024, perhaps helped by a steepening yield curve with higher term rates. Also assisting NIMs were healthier deposit and lower wholesale borrowing levels along with lower funding rates at the shorter end of the curve. As can be seen here, the 1-year/5-year curve has flattened, albeit modestly ~40 bps, during Q1 2025. As March enters its final week, time will soon tell, via industry earnings guidance, if the curve flattening stalled or impacted NIM for Q1.
FHLBNY Advance Rates Observations
Front-End Rates
- Short-end rates, as of Thursday afternoon, were modestly changed vs. the week prior. Overnight was up by 3 bps, as typical month and quarter-end dynamics exerted upward pressure in repo markets and SOFR, and, in turn, on our shortest tenors. The 3-week to 3-month zone was unchanged, while 4- to 6-month rose by 2 bps on the market’s slightly less aggressive pricing of potential Fed rate cuts this year. Robust Money Market Fund AUM levels continue to underpin demand for short-end paper. Also helpful is that net T-bill supply has been negative in recent weeks, owing to debt ceiling dynamics.
- The market will focus on economic data and trade policy news, with the Friday jobs report a key release.
Term Rates
- The longer-term curve, generally mirroring moves in USTs and swaps, was higher and steeper from the prior week. In progressive fashion, the 2- to 5-year sector was higher by 5 to 9 bps, while the 6- to 10-year sector was higher by 12 to 14 bps. Kindly refer to the previous section for color on market dynamics and changes. We encourage members to engage with the Member Services Desk for current rate levels and market dynamics.
- On the UST term supply front, the upcoming week serves as a reprieve from auctions. Note that UST auctions usually occur at 1pm and can occasionally spur volatility around that time. Please contact the Member Services Desk for further information on market dynamics, rate levels, or products.
Price Incentives for Advances Executed Before Noon: In effect as of Tuesday, September 5, 2023, the FHLBNY is pleased to now offer price incentives for advances executed before Noon each business day. These pricing incentives offer an opportunity to provide economic value to our members, while improving cash and liquidity management for the FHLBNY. For further details, kindly refer to the Bulletin.
The Symmetrical Prepayment Advance Feature
For those anticipating term funding needs, and with rates on an uptrend, it can be an appropriate juncture to consider our SPA feature. This feature allows the member to capture, at prepayment, changes in the fair value of the advance which are favorable to the member. Contact Member Services Desk to discuss.
Looking for more information on the above topics? We’d love to speak with you!
Archives
Questions?
If you wish to receive the MSD Weekly Market Update in .pdf format (includes FHLBNY rate charts) or to discuss this content further, please email the MSD Team.