Member Services Desk
Weekly Market Update
This MSD Weekly Market Update reflects information for the week ending March 21, 2025.
Economist Views
Click to expand the below image.
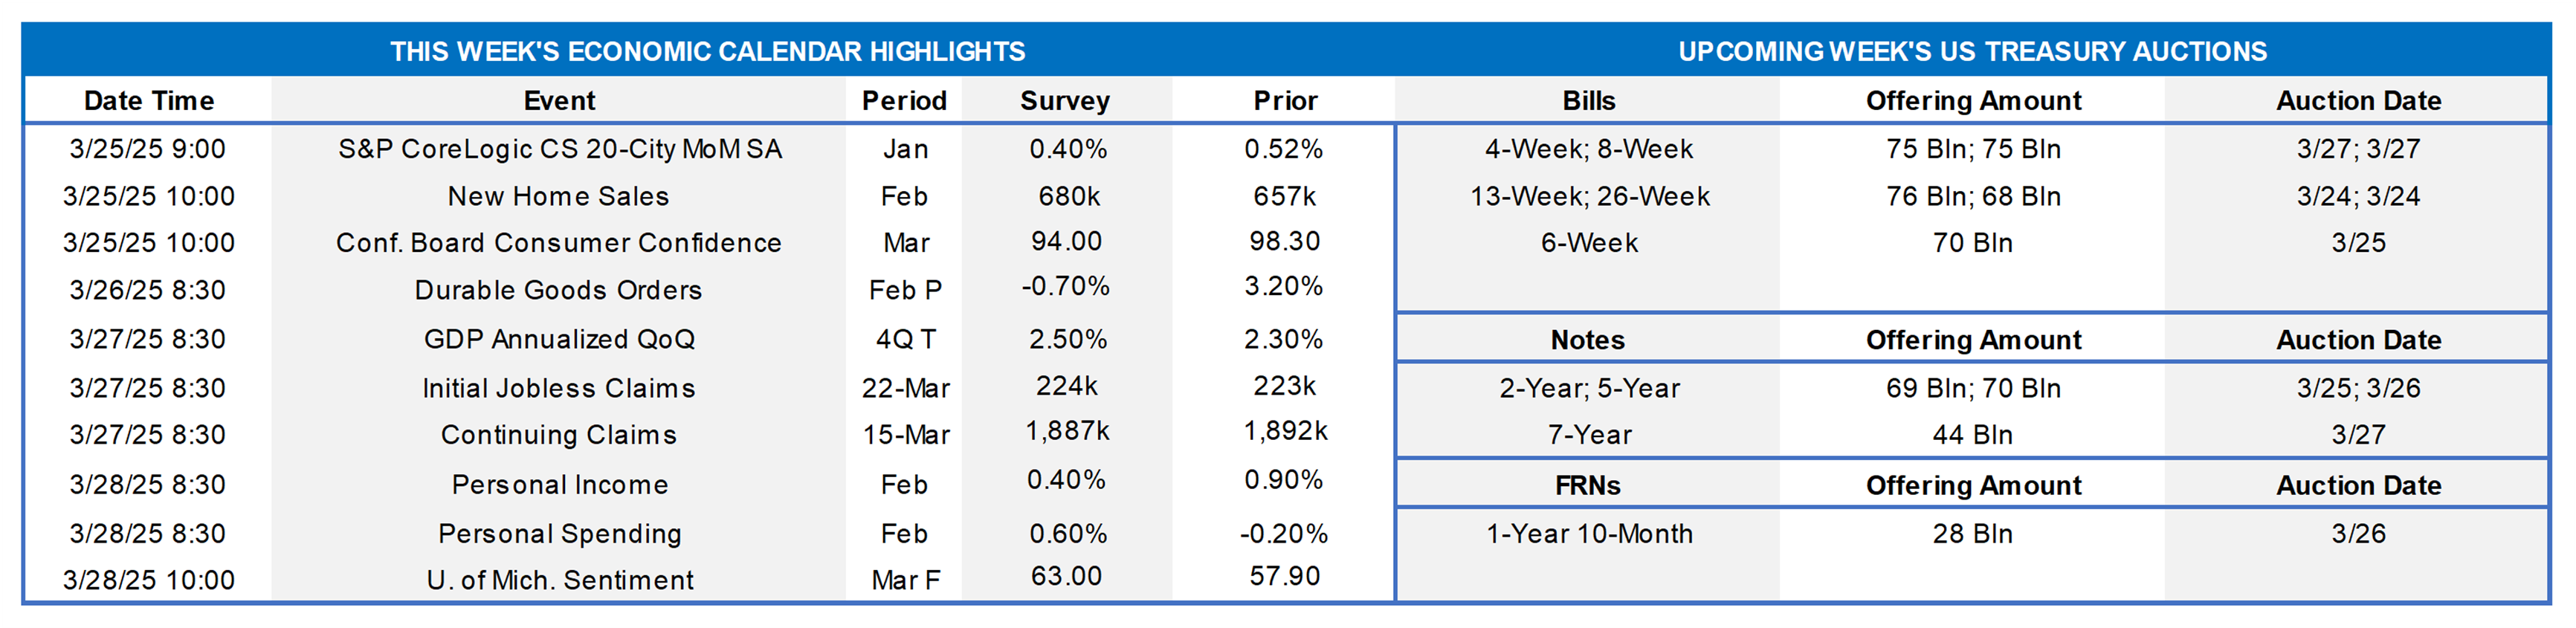
Markets will face busy and decidedly mixed data releases in the next week. New home sales likely rebounded, but prices received by sellers in major metro areas probably slipped at the beginning of 2025. Economic uncertainty has likely weighed heavily on consumers’ spirits in March. Private-sector labor market conditions likely remained tight in mid-March, but the situation for federal workers merits close attention. Imports ahead of threatened tariffs suggest that the trade deficit likely recorded a fresh wide level last month, raising the probability that real GDP contracted during Q1.
S&P CoreLogic Case-Shiller 20-City Home Price Index: Seasonal patterns suggest that home selling prices retreated by .4% in January across the 20 major metro areas canvassed by SPCLCS, erasing all but a fraction of the surprisingly strong .52% year-end gain in December. If that projection is on the mark, the SPCLCS barometer rose by 4.1% over the latest 12 months, eclipsing by a wide margin the reported 2.2% rise in consumer prices, excluding shelter costs over that span.
New Home Sales: A reported rebound in single-family housing starts suggests that contracts jumped by 9.6% to a SAAR of 720K in February, erasing all but a fraction of the falloff witnessed in January.
Conference Board Consumer Confidence: This gauge likely plunged to a nearly 11-year low of 84 in March from 98.3 last month. Watch the labor differential—the percentage of respondents believing that jobs are plentiful, less those feeling positions are hard to get—for clues to any potential change in the civilian unemployment rate in the upcoming Bureau of Labor Statistics report.
Durable Goods Orders: Pared by a commercial aircraft-led dip in transport equipment requisitions, orders probably dipped by .6% in February, erasing a portion of the 3% jump witnessed in January.
Jobless Claims: Probably remained rangebound, but those of federal employees who are covered under a separate program should be watched closely for signs of recently announced layoffs.
Merchandise Trade Balance: To be released on 3/27 — The trade deficit likely hit yet another record high in February, after the $153.3bn shortfall witnessed in January. Since the 2024 election, the reported gap in international goods transactions has leaped by almost 60%, or by a staggering $57.5bn.
Real GDP Growth: Data since the BEA’s preliminary report suggest that 2024 Q4 real growth may be marked two ticks higher to 2.5% annualized, down from the 3.1% annualized clip posted in Q3.
Pending Home Sales: To be released on 3/27 — Home purchase mortgage applications suggest that contract signings likely tumbled by 6% to a new all-time low in February.
Personal Income & Consumer Spending: Personal income growth likely slowed to .4% in February after the dividend and transfer payment-induced .9% jump posted in January. Stepped-up spending on services, combined with an anticipated rebound in goods outlays, probably propelled consumption .6% higher during the reference period, erasing a .2% prior-month dip.
Michigan Consumer Sentiment Index: Sentiment likely eroded further in recent weeks, leaving the headline sentiment gauge at 55.8—the weakest reading since the 51.5 posted in July 2022.
Federal Reserve Appearances:
- Mar. 25 New York Fed President John Williams to give opening remarks at a conference at the New York Fed.
- Mar. 26 St. Louis Fed President Alberto Musalem to speak about the economy and monetary policy.
- Mar. 27 Richmond Fed President Tom Barkin to give a lecture at Washington and Lee University.
- Mar. 28 Atlanta Fed President Raphael Bostic to moderate a panel on US housing finance policy at the Atlanta Fed.
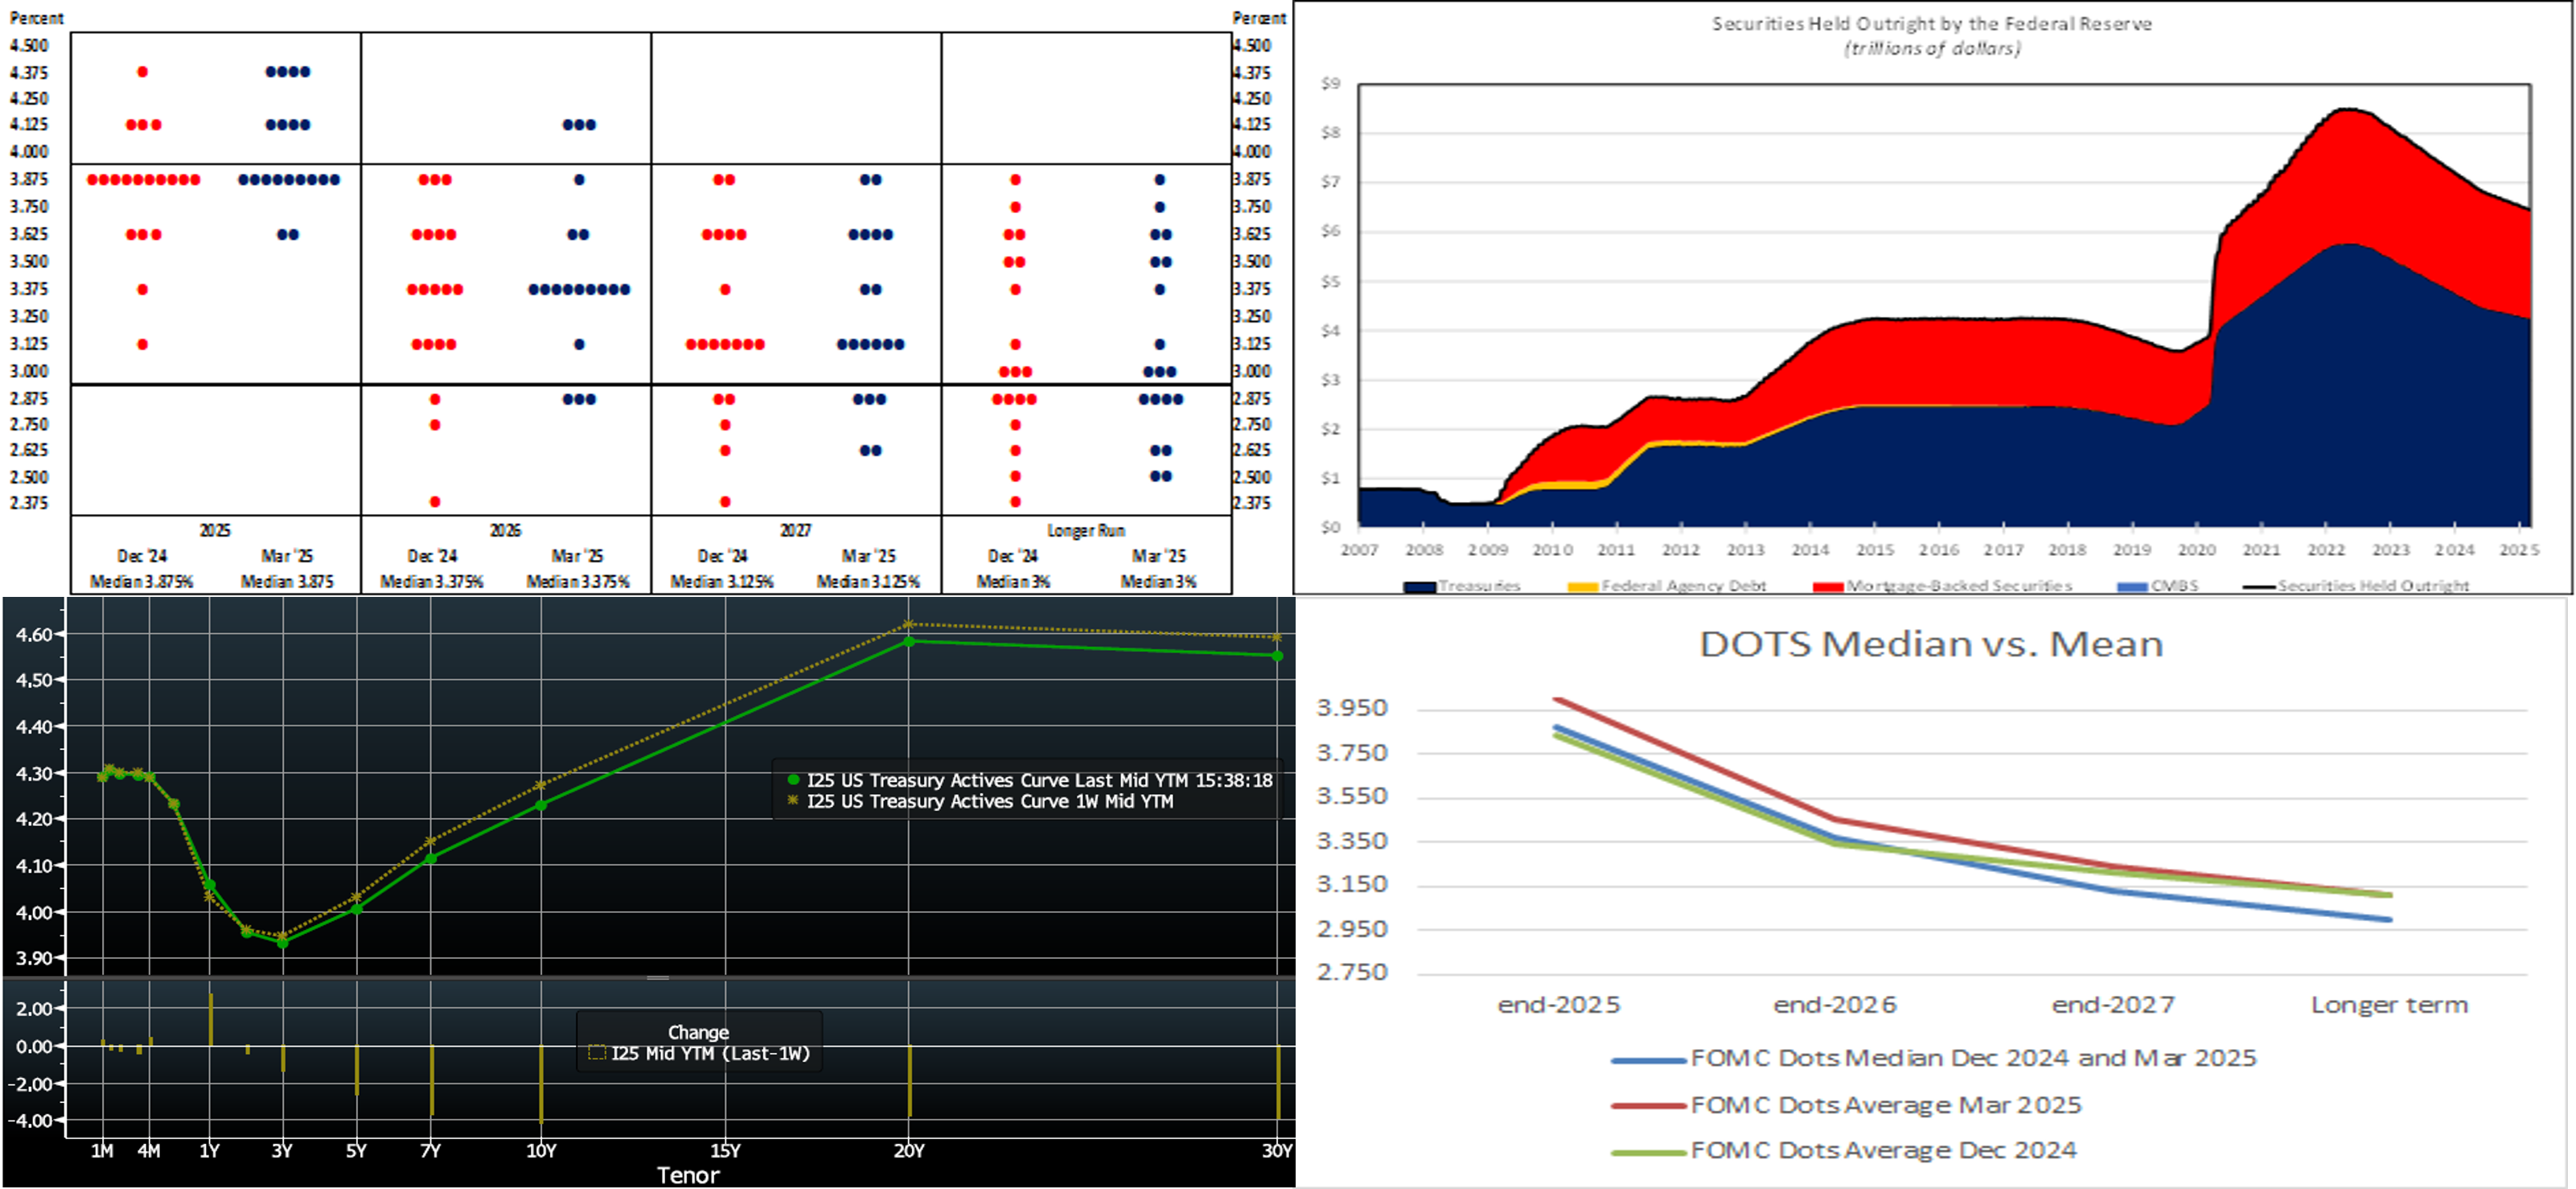
CHART 1 UPPER LEFT and CHART 2 UPPER RIGHT
Source: Board of Governors of the Federal Reserve System. As per convention, the Fed this week released an updated Summary of Economic Projections, or SEP. The so-called “dot plot” contained no changes to policymakers’ median expectations for the federal funds target rate out to the end of 2027 and over the longer run, but the forecast ranges narrowed slightly. Fed officials continue to anticipate 50 bps of cuts likely will be appropriate over the course of 2025, followed by another 50 bps of easing in 2026. The projected year-end 2025 range for fed funds stands at 3¾% to 4%, with next year’s at 3¼% to 3½%. A single 25-bps cut to 3% to 3¼% is anticipated during 2027. The longer-run rate was also unchanged from the 3% contained in the December SEP. The Fed, relative to December’s meeting, boosted its inflation and unemployment forecasts while lowering its GDP forecast for 2025. Overall, Chairman Powell stressed the theme of uncertainty. Of more immediate impact, the FOMC will continue to reduce its holdings of UST and agency debt, and agency MBS. However, beginning in April, policymakers will slow the pace of the decline of its holdings by reducing the monthly redemption cap on USTs from $25bn to $5bn. The Fed will maintain the cap on agency debt and agency MBS at $35bn as it strives to eventually achieve an all-USTs portfolio. Runoffs of maturing securities, aka Quantitative Tightening, or “QT,” have pared the System Open Market Account to $6.45trn from the $8.5trn peak reached in April 2022. The tapering in QT will slow the draining of funds from the financial system and thereby add to bank reserves. In this regard, the Fed likely wanted to get “ahead of the curve” to hedge a potential debt ceiling resolution later this year and the accompanying replenishment of the US Treasury General Account via a large ramp-up in net T-bill supply; by doing so, the Fed aims to prevent a similar episode as in 2019 which caused turmoil and upward pressure on short-end liquidity markets and rates.
CHART 3 LOWER LEFT
Source: Bloomberg. Top pane is yield (LHS, %); bottom pane is change (LHS, bps). As of Thursday afternoon, the UST term curve has mildly changed from the prior week. Yields were lower by 1 to 4 bps, led by longer tenors. This week’s highlight was the FOMC, as covered herein. As of Thursday afternoon, the market prices end-2025 fed funds ~3.655%, or 5 bps higher than a week ago, which equates to a bit shy of three 25-bps Fed cuts and is thereby more aggressive than the Fed’s 3.875% expectation. The market’s end-2026 forward is ~3.42%, or 2 bps lower than a week ago.
CHART 4 LOWER RIGHT
Source: Bloomberg; FHLB-NY. Back to the Fed’s “dot plot,”….Here is a further dissection of it and how it compared to the prior one in December. The median expectations remained the same in this week’s plot relative to December, and most news coverage focuses on the median. However, as can be seen here, the weighted average of the forecasts reveals that this week’s plot could be considered more hawkish, or at least reflective of greater risk to the upside, than December’s. While not extremely different, this week’s averages were ~17 and 11 bps higher than December’s for end-2025 and end-2026, respectively. The end-2027 and longer-term dots were essentially unchanged this week from December.
FHLBNY Advance Rates Observations
Front-End Rates
- Short-end rates, as of Thursday afternoon, were mostly unchanged vs. the week prior. Robust Money Market Fund AUM levels continue to underpin demand for short-end paper. Also helpful is that net T-bill supply has been negative in recent weeks, owing to debt ceiling dynamics. The Fed’s tapering of QT (see previous section for color) may also help liquidity near-term.
- Post the past week’s FOMC meeting, the market will refocus on data and trade policy news.
Term Rates
- The longer-term curve, generally mirroring moves in USTs and swaps, was mildly changed from the prior week. Shorter tenors were a few bps higher, but the 3- to 10-year sector was 1 to 4 bps lower, led by longer tenors. Kindly refer to the previous section for color on market dynamics and changes. We encourage members to engage with the Member Services Desk for current rate levels and market dynamics.
- On the UST term supply front, the upcoming week serves a slate of 2/5/7-year auctions. Note that UST auctions usually occur at 1pm and can occasionally spur volatility around that time. Please contact the Member Services Desk for further information on market dynamics, rate levels, or products.
Price Incentives for Advances Executed Before Noon: In effect as of Tuesday, September 5, 2023, the FHLBNY is pleased to now offer price incentives for advances executed before Noon each business day. These pricing incentives offer an opportunity to provide economic value to our members, while improving cash and liquidity management for the FHLBNY. For further details, kindly refer to the Bulletin.
Looking for more information on the above topics? We’d love to speak with you!
Archives
Questions?
If you wish to receive the MSD Weekly Market Update in .pdf format (includes FHLBNY rate charts) or to discuss this content further, please email the MSD Team.