Member Services Desk
Weekly Market Update
This MSD Weekly Market Update reflects information for the week ending March 15, 2024.
Economist Views
Click to expand the below image.
The Federal Open Market Committee (FOMC) meeting will be the marquee event of the upcoming week. Policymakers are almost universally expected to leave the federal funds rate target range unaltered at 5¼% to 5½%. The post-meeting communiqué likely will reiterate that economic activity has been expanding at a solid pace and that, while job gains have moderated from early last year, they remain strong, and the unemployment rate is low. The policy statement can be expected to repeat that, while the FOMC believes that the risks to achieving its employment and inflation goals are moving into better balance, the economic outlook is uncertain and committee members are highly attentive to inflation risks. The upcoming communiqué probably will again omit any forward guidance on the likely direction of administered rates yet also note that policymakers would be prepared to adjust monetary policy if risks emerge to the attainment of their goals. Most important, the statement probably will repeat that the FOMC does not expect it will be appropriate to reduce the target range until it has gained greater confidence that inflation is moving sustainably toward 2 percent. The FOMC will continue its portfolio runoff of maturing Treasurys and agency debt and agency mortgage-backed securities.
The Federal Reserve Board will also release an updated Summary of Economic Projections, or SEP. The so-called “dot plot” of policymakers’ expectations for the federal funds rate target through 2026 will receive considerable attention from traders and investors. Meeting participants will also update their forecasts for real GDP growth, the unemployment rate, and key inflation measures.
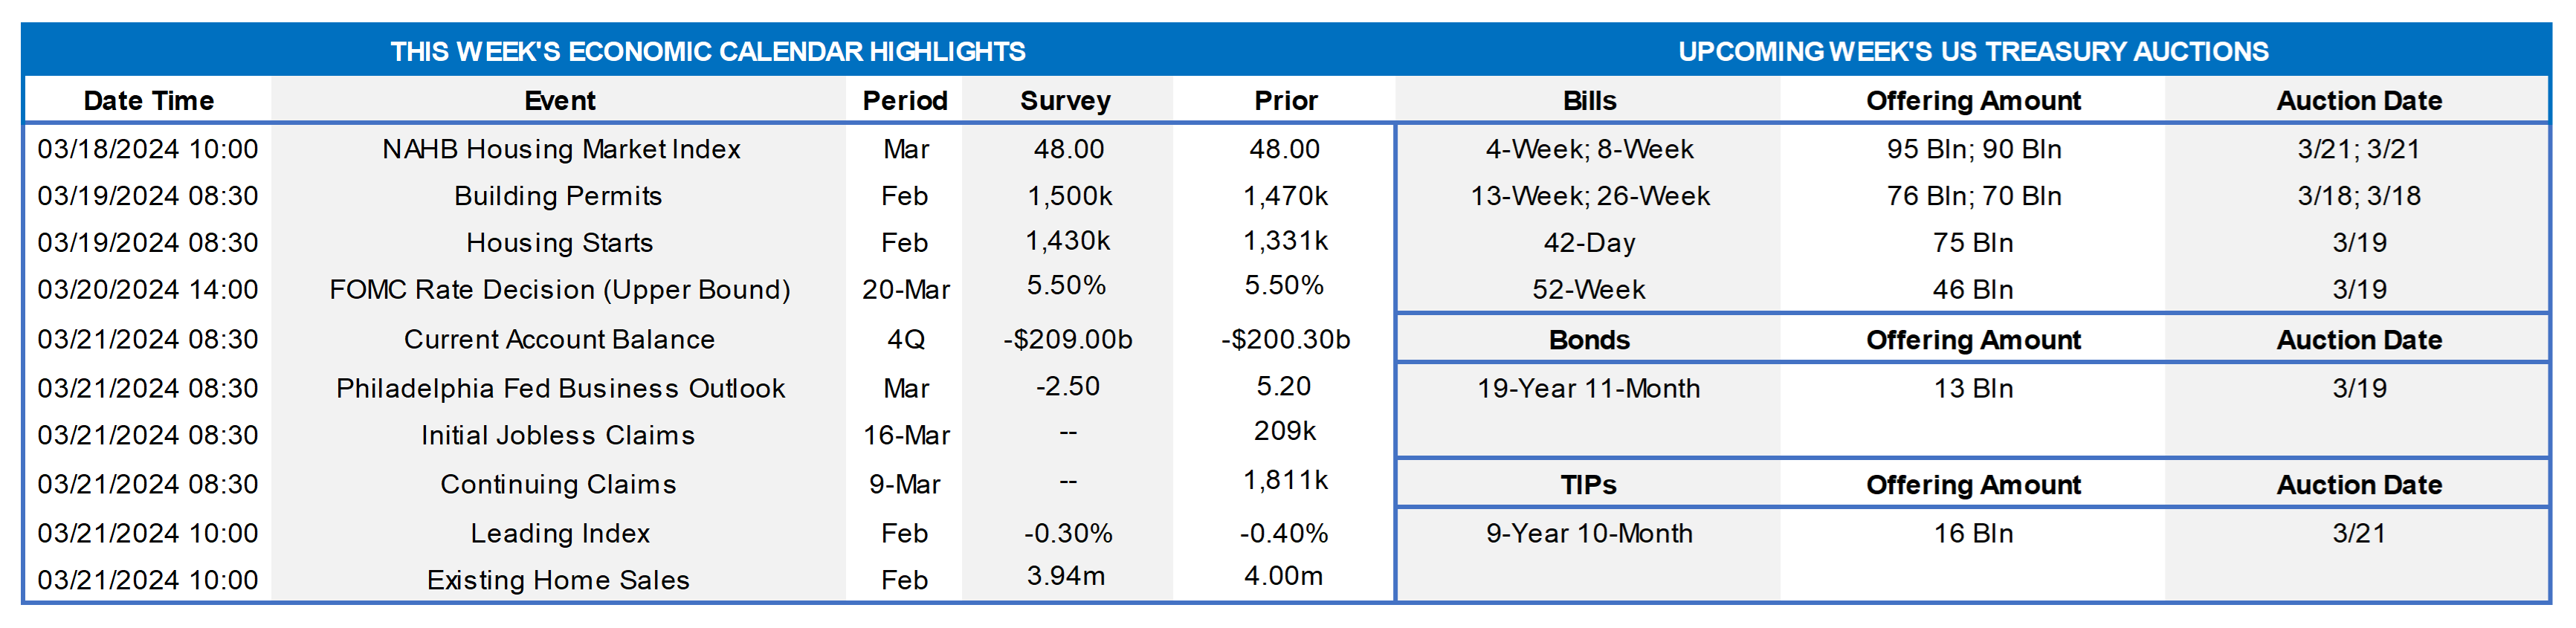
NAHB Housing Market Index: Rosier appraisals of current and prospective sales, combined with an improvement in prospective buyer traffic, probably pushed the National Association of Home Builders’ confidence gauge back to the neutral 50-point mark from 48 in February.
Housing Starts & Building Permits: While the Street expects both housing starts and the number of building permits issued to rebound to respective SAARs of 1.425mn and 1.5mn in February, a dramatic improvement in weather conditions from those prevailing in January suggests that both of those forecasts likely will prove way too low.
Jobless Claims: Initial claims for unemployment insurance benefits probably remained rangebound between 200-220K during the filing period ended March 16. Continuing claims – the total number of persons collecting benefits – likely clocked in below the 1.9mn mark during the week ended March 9 – a sign that the recently unemployed are having little problem finding work.
Index of Leading Economic Indicators: The Conference Board’s augur of prospective economic activity is expected to have fallen by .3% in February. While that result would mark the 23rd straight decline in the LEI, the economy has shown few signs of faltering. Indeed, the Federal Reserve Bank of St. Louis’ smoothed recession probabilities model placed the probability that the economy was contracting in January at a negligible .3%.
Existing Home Sales: A reversal in home-purchase contract signings in January suggests that closings nationwide dipped by .7% to a SAAR of 3.97mn in February. With the number of available homes on the market likely to contract by 1% to 1mn on a not seasonally adjusted basis during the reference period, the supply at the estimated sales pace would hold steady at three months.
Federal Reserve Appearances:
- Mar. 19 Federal Open Market Committee (FOMC) meeting begins.
- Mar. 20 FOMC policy statement and updated Summary of Economic Projections to be released.
- Mar. 20 Fed Chair Powell to hold post FOMC-meeting press conference.
- Mar. 22 Atlanta Fed President Bostic to participate at the 2024 Household Finance Conference in Atlanta.
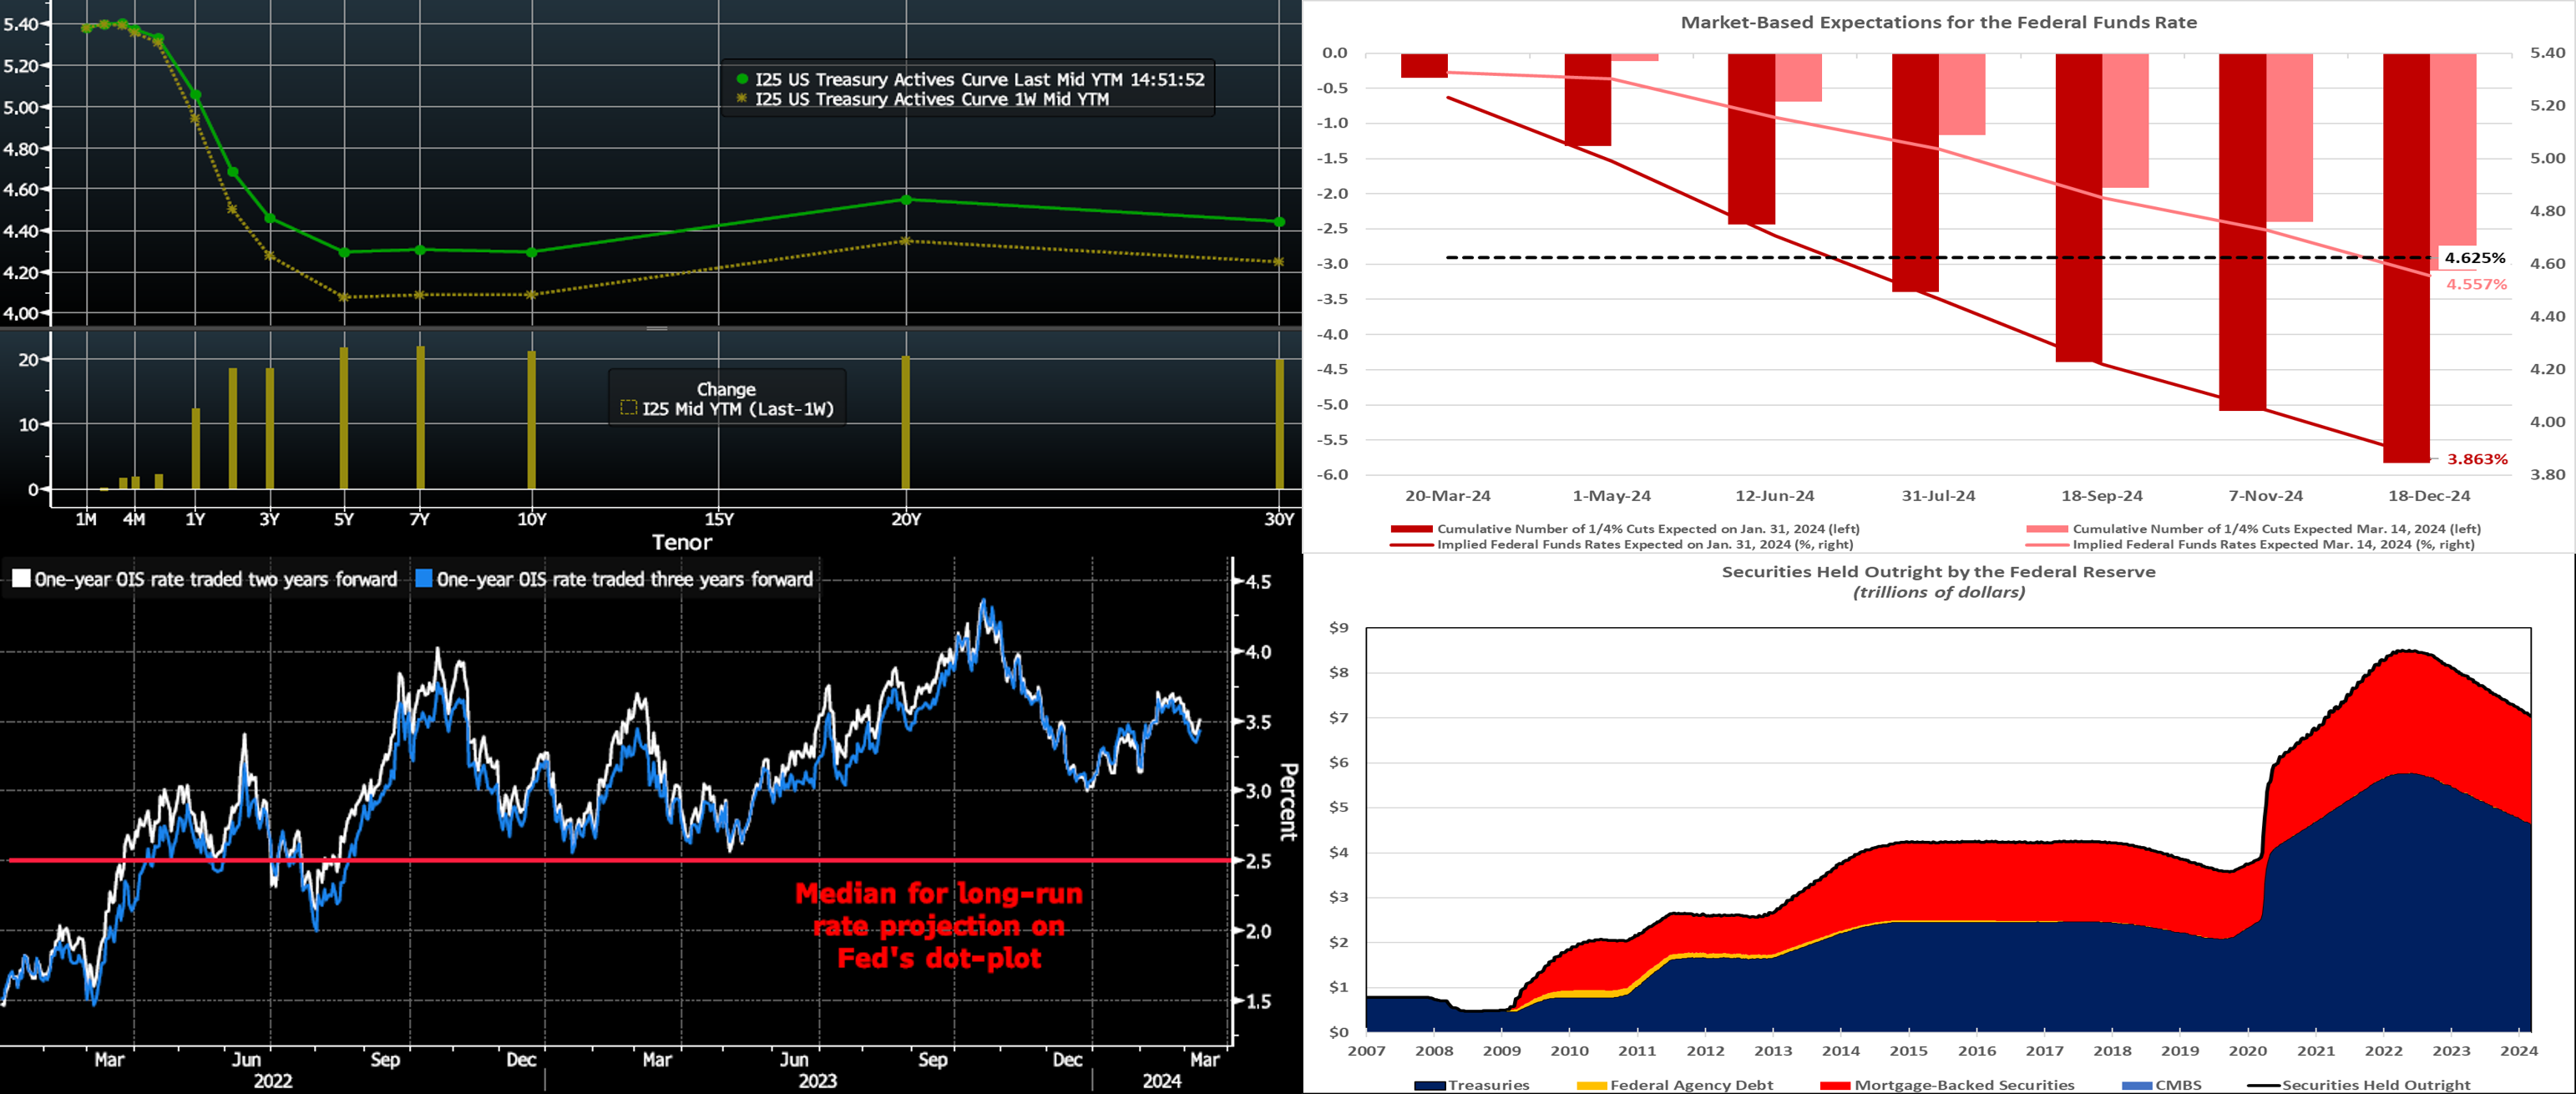
CHART 1 UPPER LEFT
Source: Bloomberg. Top pane is yield (LHS, %), bottom pane is change (LHS, bps). From last Thursday afternoon to this one, the UST curve reversed course from the week prior, thereby sending yields higher by 15 to 22 bps. The 5- to 10-year sector led the move, as stronger-than-expected inflation data and a heavy slate of UST issuance spurred upward pressure on the curve. In terms of market-implied pricing of the Fed, a full 100% probability of a 25 bp cut is still August 1st, with the June 13th FOMC priced at ~62% chance, down from 92% last week. The year-end 2024 forward is ~4.59%, roughly 17 bps higher than last week. Therefore, the market prices for a cumulative total of ~74 bps of cuts by the end of 2024, or ~17 bps less than a week ago. Please find further color below on the Fed and pricing.
CHART 2 UPPER RIGHT
Source: Bloomberg; FHLB-NY. As of midday Thursday, shown here is the current market pricing (Pink, RHS %, LHS cumulative number of cuts) of the path of the Fed Funds rate vs. that prevailing at the last FOMC (Red) on January 31st. Clearly the market has undergone a major recalibration of its pricing over the last six weeks, driven by stronger-than-expected economic data and Fedspeak that has reinforced its patient and “more work to be done” posture. As of this writing, the 2024 yearend market pricing is less than a handful of bps below the Fed’s last “dot plot” projection of 4.625%. On January 31st the market priced at ~76 bps below the Fed’s yearend dot, and on January 16th it priced ~86 bps below. In sum, over three 25 bps rate cuts have subsequently been priced out by the market, thereby now leaving market pricing aligned, unless this week’s new dot plot changes, with the Fed for 2024.
CHART 3 LOWER LEFT
Source: Bloomberg. An interesting dynamic when comparing market pricing to the Fed’s dot plot has been that, whereas market pricing has been below the dot plot in the shorter timeframes, it has mostly been above the Fed’s median long-run dot of 2.5%. This trend is evident here, as the Fed’s long-run dot (red line) has usually been lower than the 1- and 2-year forward 1-year Overnight Index Swap (OIS, Fed Funds rate proxy). Currently, the 3-year forward 1-year OIS is ~3.59%. While some of the market’s pricing can be attributed to term premium, perhaps also the market is expressing the view that rates will not return to the lower levels of the post-Great Financial Crisis period. It will be interesting to see if the Fed’s long-run projection is revised higher in the fresh dot plot. If it is, then yields may encounter some upside risk. However, as we see here, the market is already pricing a higher long-run rate.
CHART 4 LOWER RIGHT
Source: Board of Governors of Federal Reserve System; FHLB-NY. The policy statement following the upcoming FOMC meeting likely will reiterate that the Fed will continue to reduce its holdings of UST and agency debt and agency MBS, as described in the Plans for Reducing the Size of the Federal Reserve’s Balance Sheet that was issued last year. To date, as seen here, runoffs of maturing securities have pared the System Open Market Account, or SOMA, by $1.47trn to currently $7.04trn from the $8.51trn peak reached in April 2022. However, many Fed-watchers anticipate possible discussion of when and how to slow this “Quantitative Tightening” process; perhaps some light will be shed on this topic in the press conference. Most strategists expect a paring back of runoff to be announced and implemented by mid-year. The Fed may also consider buying T-bills to replace its MBS runoff, as a means of better managing its asset and liability structure. Basically, the Fed wishes to reduce its balance sheet to rebuild capacity for potential future use, but, at the same time, it wishes to do so without roiling short-term rate markets and the level of bank reserves.
FHLBNY Advance Rates Observations
Front-End Rates
- Short-end rates were mildly mixed week-over-week, with the shorter tenors a bp or two lower but the 6-month higher by 2 bps. Net T-bill supply, after a long spell in positive territory, is now expected to decrease and eventually turn negative next month. This development, all else equal, may help tighten spreads on FHLB paper. Moreover, short-end supply continues to be absorbed well, as Money Market Funds (MMFs) currently stand at or near all-time high AUM levels.
- The FOMC meeting is clearly the headline event of the upcoming week.
Term Rates
- The longer-term curve, generally mirroring moves in USTs and swaps, was higher week-on-week by 17 to 22 bps in the 2-year-and-out sector. The 5-year led the move. Please refer to the previous section for color.
- On the UST term supply front, the upcoming week serves a 20-year nominal and a 10-year TIPS auction. Corporate bond supply, meanwhile, has been at record levels and may remain heady. Note that UST auctions usually occur at 1pm and can occasionally cause volatility around that time. Please contact the Member Services Desk for further information on market dynamics, rate levels, or products.
Grant funding under the FHLBNY 2023 Small Business Recovery Grant (SBRG) Program has begun and some funds are still available. The SBRG Program provides grant funds to benefit FHLB-NY members’ small business and non-profit customers. Please visit the SBRG webpage.
Price Incentives for Advances Executed Before Noon: In effect as of Tuesday, September 5, 2023, the FHLBNY is pleased to now offer price incentives for advances executed before Noon each business day. These pricing incentives offer an opportunity to provide economic value to our members, while improving cash and liquidity management for the FHLBNY. For further details, kindly refer to the Bulletin.
The Symmetrical Prepayment Advance Feature
For those anticipating term funding needs, and with rates on an uptrend, it can be an appropriate juncture to consider our SPA feature. This feature allows the member to capture, at prepayment, changes in the fair value of the advance which are favorable to the member. Contact Member Services Desk to discuss.
Looking for more information on the above topics? We’d love to speak with you!
Questions?
If you wish to receive the MSD Weekly Market Update in .pdf format (includes FHLBNY rate charts) or to discuss this content further, please email the MSD Team.