Member Services Desk
Weekly Market Update
This MSD Weekly Market Update reflects information for the week ending March 14, 2025.
Economist Views
Click to expand the below image.
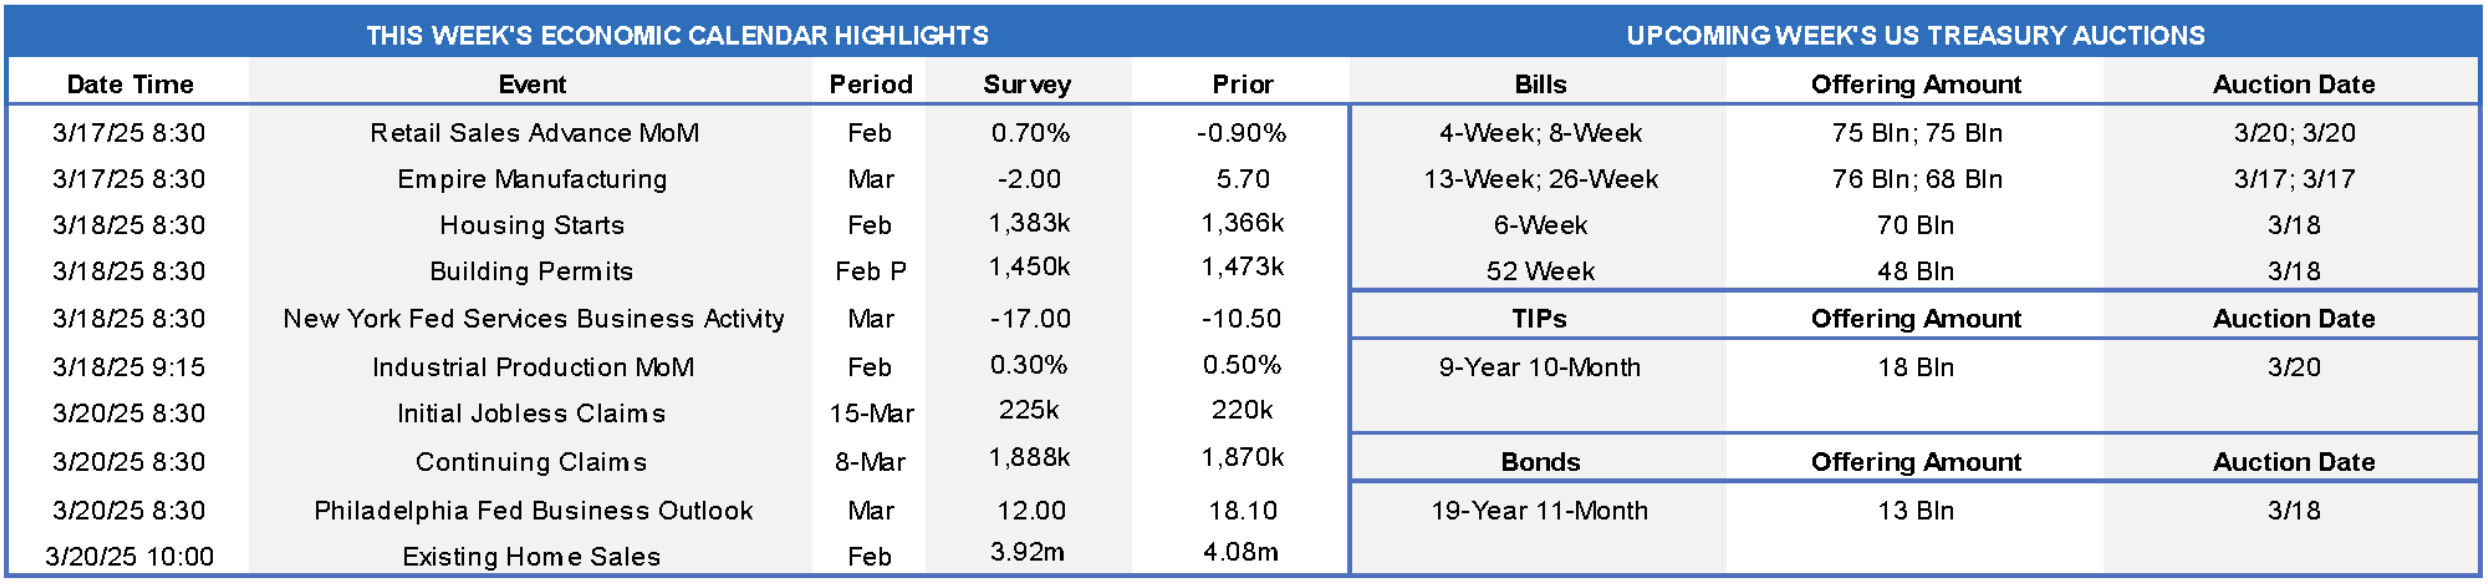
The Federal Open Market Committee (FOMC) meeting will highlight the coming week. The FOMC is expected to leave the federal funds rate target range unaltered at 4¼% to 4½%. Given recent data, the post-meeting communiqué may note that the economic activity pace has slowed from that of Q4 but that the unemployment rate remains low and labor market conditions solid. The statement likely will omit any mention of progress in returning inflation to the 2% objective, merely citing that inflation remains somewhat elevated. The statement will probably reiterate that the FOMC judges the risks to achieving its employment and inflation goals as roughly balanced. In assessing the appropriate stance of policy, policymakers will continue to monitor the implications of incoming information and will be prepared to adjust policy if necessary for the attainment of the Fed’s goals. The Fed will continue to pare its securities holdings at the pace set out at last April’s FOMC meeting. To date, runoffs of maturing securities have pared the System Open Market Account to $6.45trn from the $8.5trn peak reached in April 2022. The Fed will also release an updated Summary of Economic Projections. This so-called “dot plot” of policymakers’ projections for the federal funds rate target through 2027 will undoubtedly receive considerable attention.
Retail & Food Services Sales: Stepped-up purchases across a wide variety of business segments probably propelled retail and services sales .9% higher in February, completely erasing the .9% decline witnessed in January. Tipped off by the already reported bounce back in unit motor vehicle sales, auto-dealership revenues likely expanded by 1.8% during the reference period, erasing almost two-thirds of the 2.8% prior-month drop. Net of a projected rebound in motor vehicle purchases, retail sales probably climbed by .7%, after a .4% beginning-of-the-year drop. As always, market participants will be paying attention to so-called “control” sales, excluding auto, building materials, and gasoline purchases, in this week’s report for clues to the pace of consumer spending during the current quarter. Barring any prior-month revisions, a .9% jump would place core purchases over the January-February span a lackluster .8% annualized above their October-December average, following a solid 4.8% annualized Q4 gain.
Empire State Manufacturing Survey: Activity probably contracted in early March, leaving the business conditions diffusion index in negative territory after the 5.7% reading recorded in February.
Housing Starts & Building Permits: Buoyed by drier and warmer weather conditions, the number of new housing units started probably rose by 3.2% to a seasonally adjusted annual rate of 1.41mn in February, reversing almost one-third of the 9.8% drop witnessed in January. The number of new building permits issued likely moved higher as well, climbing by 5.2% to a 12-month high of 1.55mn.
NY Fed Service-Producing Survey: Echoing the anticipated decline in its manufacturing barometer, the Federal Reserve Bank of New York’s gauge of activity across New York State, northern New Jersey, and southwestern Connecticut likely remained in contractionary territory for a sixth straight month, although it probably improved from the -10.5% reading posted in February.
Industrial Production & Capacity Utilization: Output at factories, mines and utilities is expected to have climbed .5% higher in February, matching the stronger-than-expected January rise. With output gains projected to outpace additions to productive capacity during the reference period, the overall operating rate likely moved two ticks higher to 78% – the highest reading since last June.
Existing Home Sales: Weaker home-purchase contract signings over the December-January span suggest that sales probably declined by 3.9% to a five-month low seasonally adjusted annual rate of 3.92mn in February. With the number of available homes on the market likely to climb by 5% to 1.24mn on a not seasonally adjusted basis during the period, the supply at the estimated sales pace would move three ticks higher to 3.8 months.
Federal Reserve Appearances:
- Mar. 19 FOMC post-meeting communique and updated Summary of Economic Projections to be released. Federal Reserve Chair Jerome Powell to hold post FOMC meeting press conference.
- Mar. 21 New York Fed President John Williams gives keynote remarks at a conference in Nassau, Bahamas.
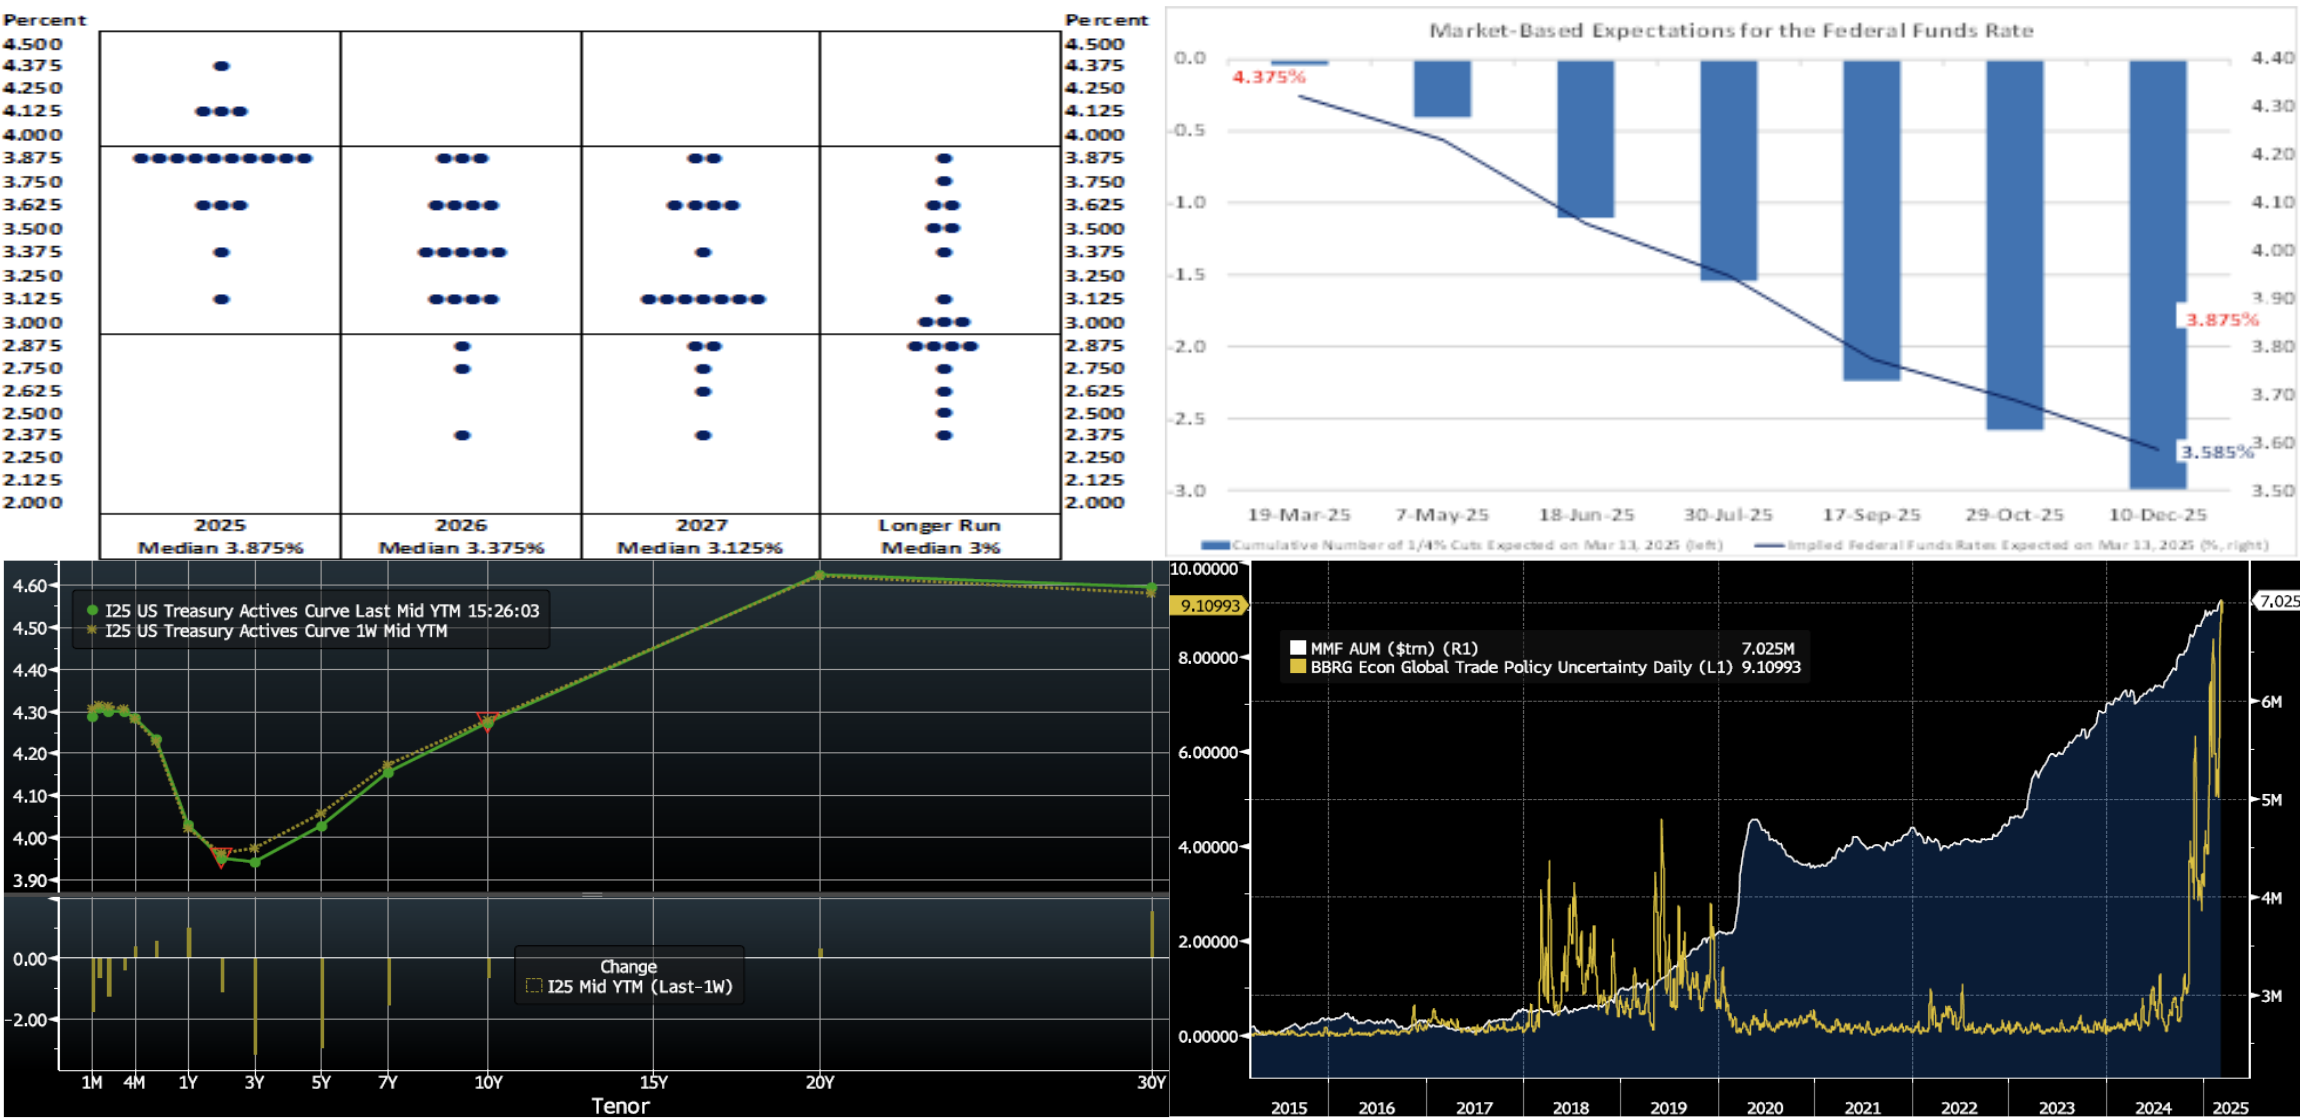
CHART 1 UPPER LEFT and CHART 2 UPPER RIGHT
Source: Bloomberg and Board of Governors of the Federal Reserve System. Note: Year-end Fed officials’ projections are highlighted in red. As per convention, the Federal Reserve Board will release an updated Summary of Economic Projections, or SEP. This so-called “dot plot” of policymakers’ projections for the federal funds rate target through 2027 will receive considerable attention from traders and investors. At the time of the December FOMC meeting, policymakers believed that the equivalent of two 25-bps cuts in administered rates might be appropriate over the course of this year, placing the target range at 3¾% to 4%. The median call for end-2026 at that time entertained the possibility of a further 50 bps of accommodation, leaving the fed funds rate range at 3¼% to 3½%. Another 25-bps reduction was expected during 2027, placing the target range at 3% to 3¼%, just slightly above the 3% expected to prevail over the longer run. Amid growing concerns about the performance of the economy, market participants’ rate-cut expectations for this year have increased in the past month and are now slightly more aggressive than those of Fed officials in the December SEP. The market, as of Thursday afternoon, prices the equivalent of almost three cuts in 2025.
CHART 3 LOWER LEFT
Source: Bloomberg. Top pane is yield (LHS, %); bottom pane is change (LHS, bps). As of Thursday afternoon, despite intra-week gyrations, the UST term curve only modestly changed from the week prior. Most tenors fell 1 to 3 bps, with the 3- to 5-year sector leading the move. The week has contained further flurries on the trade policy/tariff front, and weakness in equities has underpinned flight-to-safety demand for UST’s. The market has notably re-priced 2025 Fed-easing expectations lower in the past three weeks. As of Thursday afternoon, the market prices end-2025 fed funds ~3.60%, or the same as a week ago, which equates to just shy of three 25-bps Fed cuts. The market’s end-2026 forward is ~3.44%, or 6 bps lower than a week ago.
CHART 4 LOWER RIGHT
Source: Bloomberg. Cited above were the market’s growing concerns about the economy, and a large degree of the concern certainly emanates from trade and tariff policy dynamics. As seen here, the Bloomberg Global Trade Policy Uncertainty Daily index has spiked in the past month and is “country miles” above levels seen in the past ten years, including the period of the prior Trump administration. The heightened uncertainty is likely contributing to increased flows into money market funds (MMFs). MMF AUM (White, RHS, $trn) has risen to fresh record levels in the past week. The MMF complex remains an attractive “safe house” for short-term investments at higher yields than bank deposits.
FHLBNY Advance Rates Observations
Front-End Rates
- Short-end rates, as of Thursday afternoon relative to a week prior, were modestly changed. Shorter tenors were 1 to 3 bps lower, whereas 6-month rose by 1 bp. Robust Money Market Fund AUM levels, reaching another record high over $7trn, continue to underpin demand for short-end paper. Also helpful is that net T-bill supply is expected to remain negative in the month ahead, owing to debt ceiling dynamics.
- The highlight of the upcoming week will be Wednesday’s FOMC outcome and guidance.
Term Rates
- The longer-term curve, generally mirroring moves in USTs and swaps, declined 2 to 5 bps, with the 4- to 5-year zone leading the move. Kindly refer to the previous section for color on market dynamics and changes. We encourage members to engage with the Member Services Desk for current rate levels and market dynamics.
- On the UST term supply front, the upcoming week serves a 20-year nominal and 10-year TIPS auction. Note that UST auctions usually occur at 1pm and can occasionally spur volatility around that time. Please contact the Member Services Desk for further information on market dynamics, rate levels, or products.
Price Incentives for Advances Executed Before Noon: In effect as of Tuesday, September 5, 2023, the FHLBNY is pleased to now offer price incentives for advances executed before Noon each business day. These pricing incentives offer an opportunity to provide economic value to our members, while improving cash and liquidity management for the FHLBNY. For further details, kindly refer to the Bulletin.
Looking for more information on the above topics? We’d love to speak with you!
Archives
Questions?
If you wish to receive the MSD Weekly Market Update in .pdf format (includes FHLBNY rate charts) or to discuss this content further, please email the MSD Team.