Member Services Desk
Weekly Market Update
This MSD Weekly Market Update reflects information for the week ending February 28, 2025.
Economist Views
Click to expand the below image.
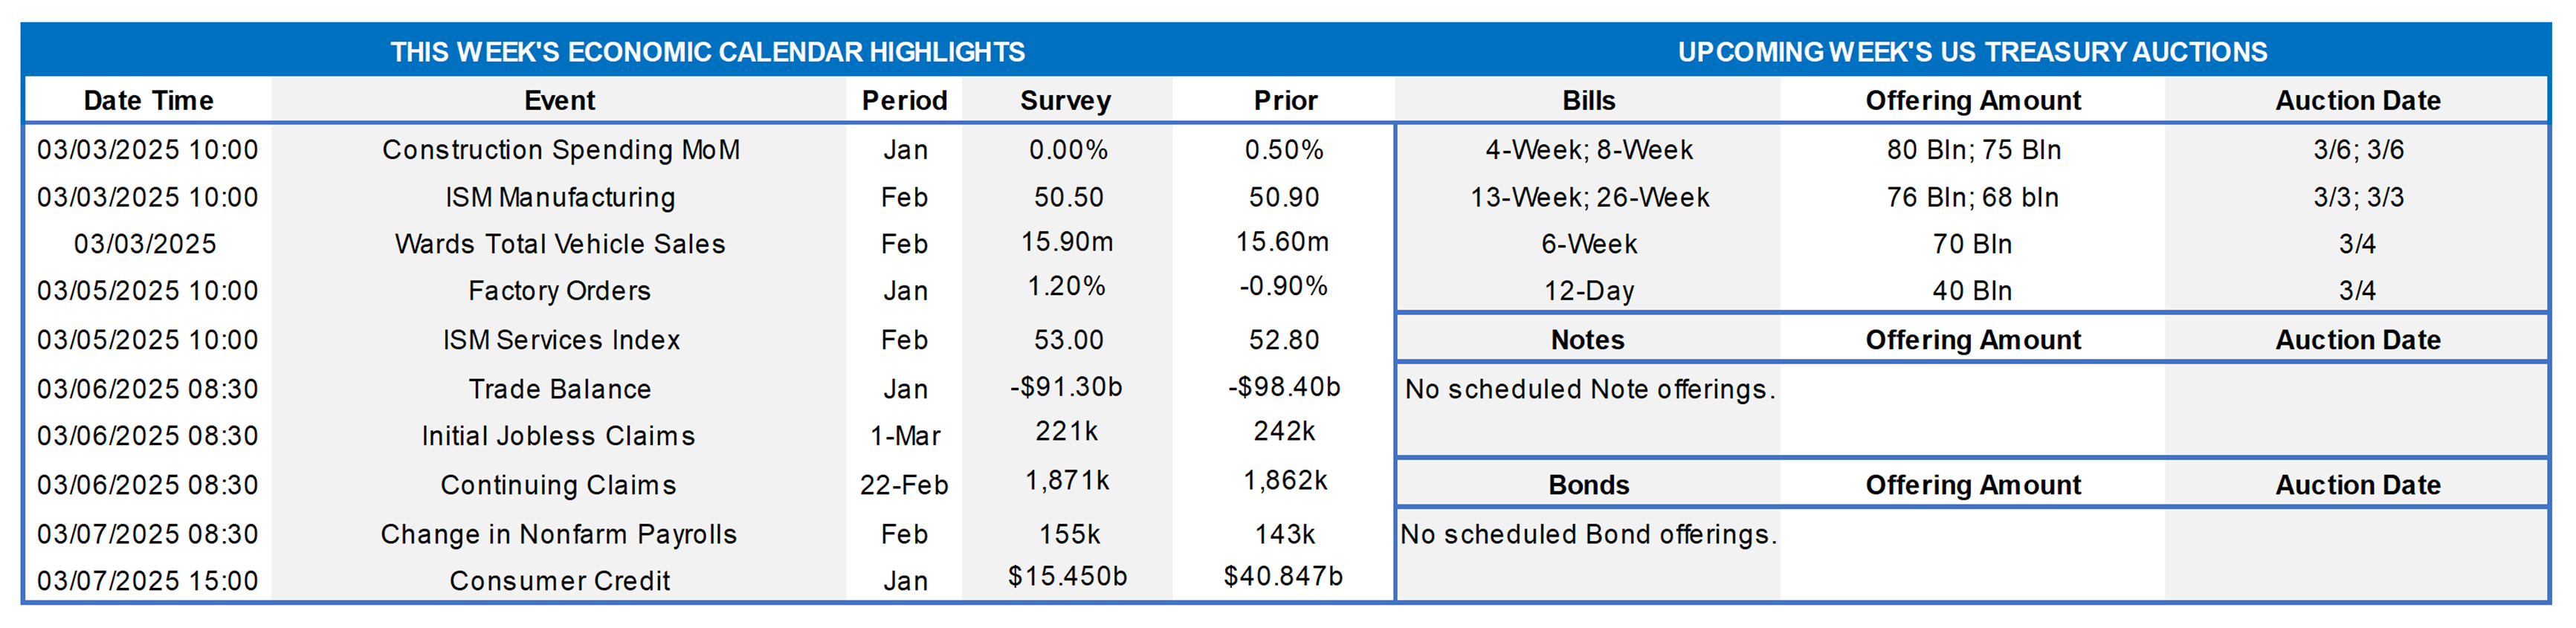
The market’s focus will return to the labor side of the Federal Reserve’s dual mandate this week when the Bureau of Labor Statistics (BLS) releases on March 7th its update on the employment situation in February. Net hiring likely quickened during the reference period, with nonagricultural establishments adding approximately 250K net new jobs, following the weather-capped 143K gain witnessed in January. Weekly jobless claims reports suggest that the civilian unemployment rate held steady at 4% in February, leaving the Sahm-Rule recession gauge at .23%, further away from the .5% critical value consistent with previous business-cycle turning points. With the BLS’ canvassing period ending precisely on the 15th, an upside surprise on average hourly earnings compared to the Street’s median .3% projection may also occur. Results in line with the above projections would undoubtedly push expectations of an impending rate cut further out and might even be enough to alter policymakers’ projections in the “dot plot” to be released after the mid-March FOMC meeting. On the Fedspeak circuit, a quartet of Fed officials will provide thoughts on a variety of topics.
Construction Spending: The nominal value of new construction put-in-place probably held steady in January, following a 2.3% cumulative increase over the final three months of 2024.
ISM Manufacturing Activity Index: Available manufacturing canvasses suggest that the Institute for Supply Management’s closely followed activity gauge remained in expansionary territory for a second straight month in February, with the Purchasing Managers Index registering at an unchanged 50.9.
Motor Vehicle Sales: Capped by an uncertainty induced slowdown in production, sales likely climbed by 1.9% to a seasonally adjusted annual rate of 15.9mn in February, reversing one quarter of January’s reported decline.
Factory Orders: Powered by an aircraft-led jump in durable goods bookings, orders likely climbed by 2.4% in January, more than offsetting the 1.7% decline over the November-December span.
ISM Service-Producing Activity Index: The expansion in service-producing activity probably narrowed further in February, with the Institute for Supply Management’s barometer retreating to an eight-month low of 50.3% from 52.8% in January.
International Trade Balance: A record gap in merchandise trade activity prompted by tariff concerns likely widened the combined deficit on international trade in goods and services in January from the $98.4bn shortfall witnessed in December.
Consumer Credit: Consumer installment credit growth probably slowed sharply in January, after record $40.8bn prior-month takedown.
Federal Reserve Appearances:
- Mar. 3 St. Louis Fed President Alberto Musalem to speak at a National Association for Business Economics conference.
- Mar. 4 New York Fed President John Williams to be interviewed by Michael McKee at the Bloomberg Invest Forum.
- Mar. 4 Richmond Fed President Tom Barkin to repeat speech from prior week on “Inflation Then and Now.”
- Mar. 6 Atlanta Fed President Bostic to speak to The Birmingham Business Journal about the economic outlook, local area.
- Mar. 7 New York Fed President Williams to participate in a discussion about “Monetary Policy Transmission Post-Covid.”
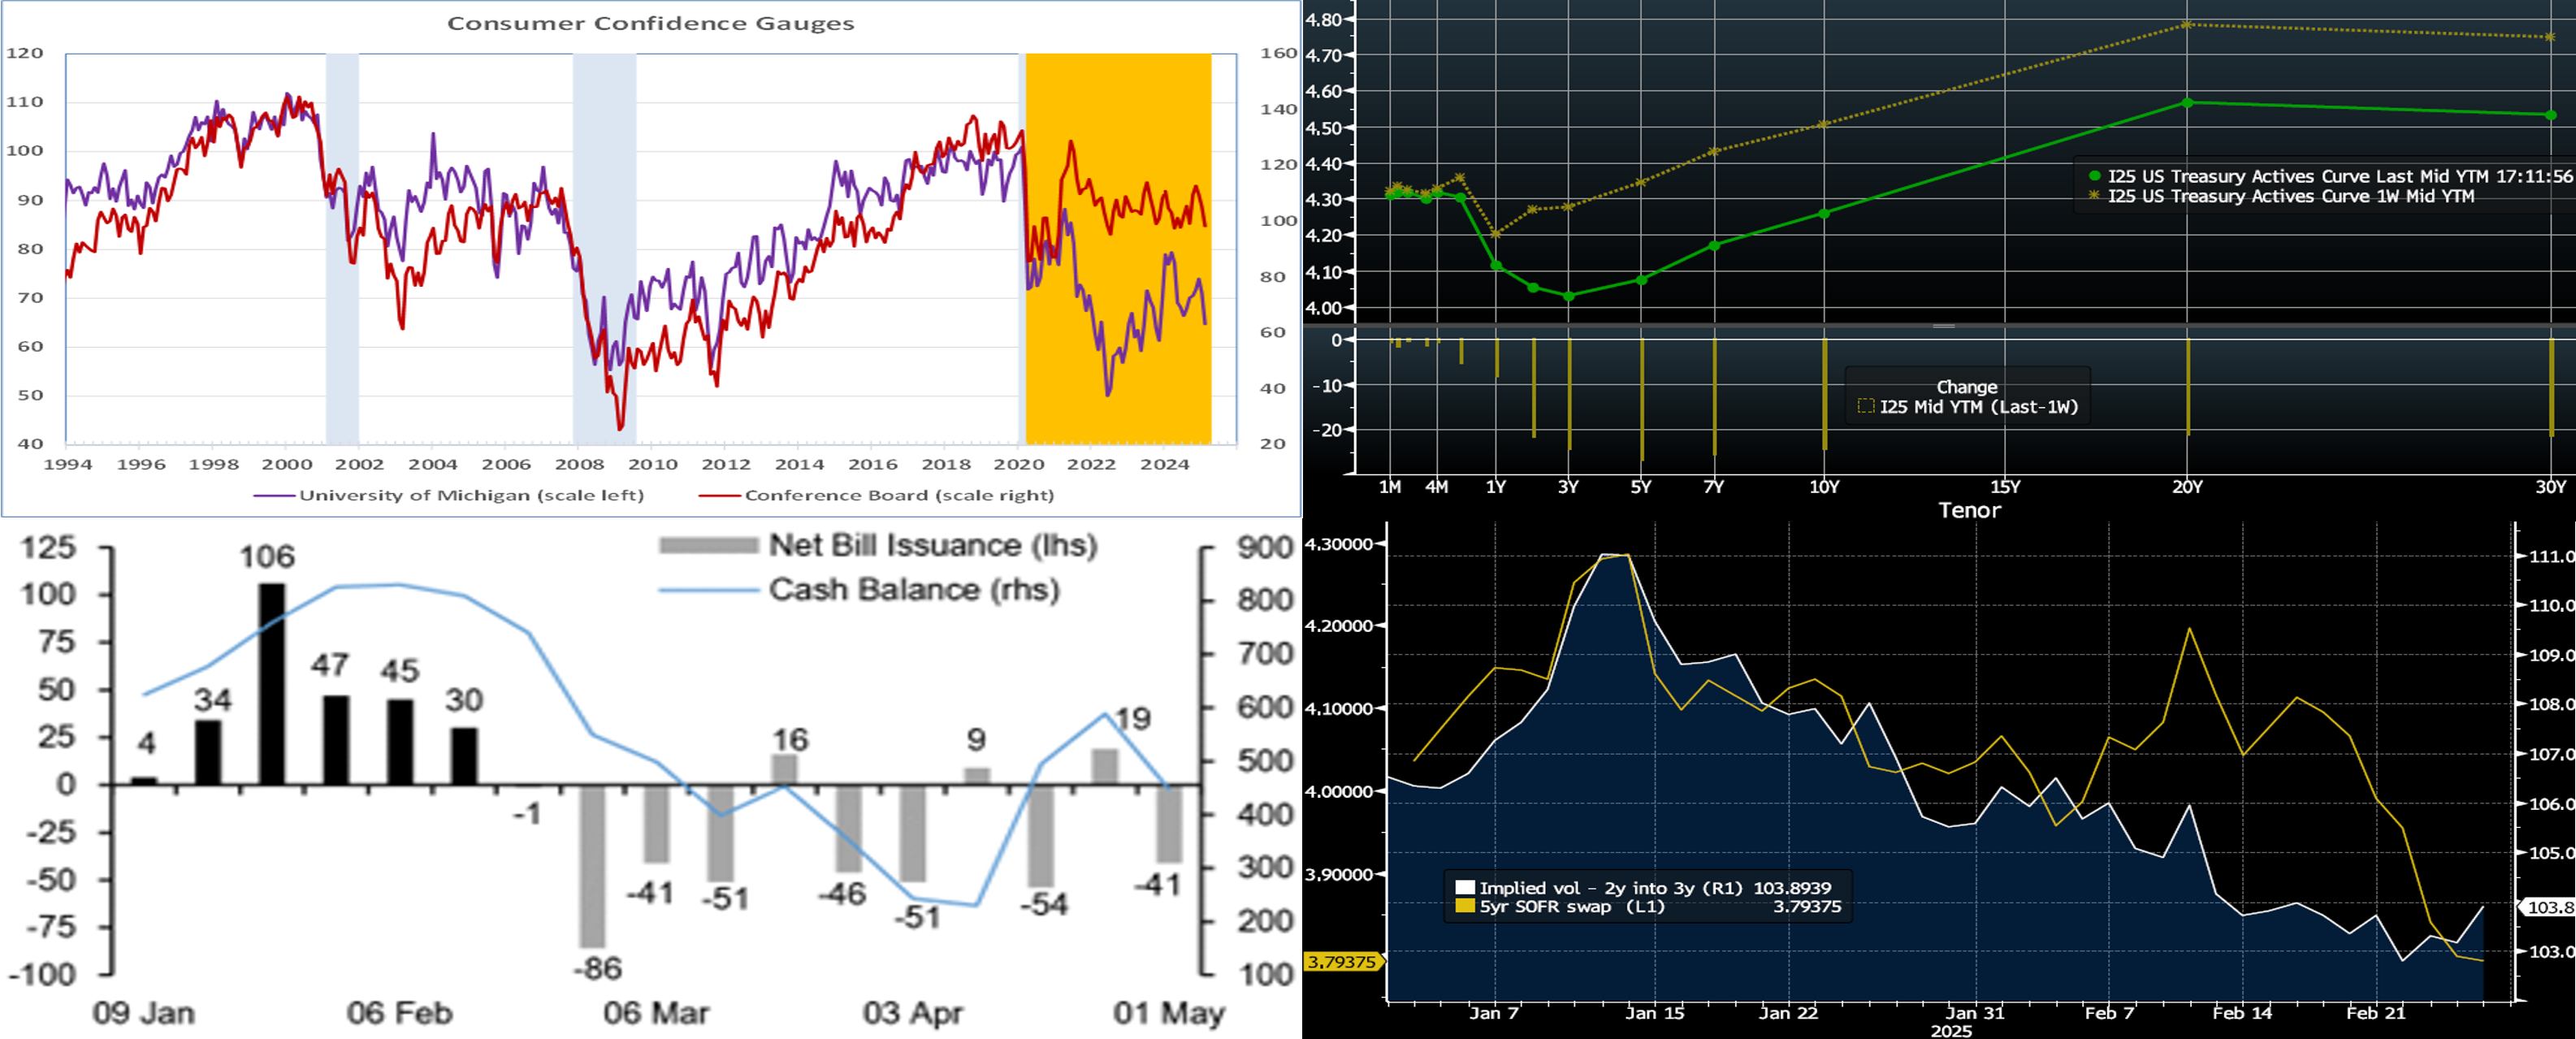
CHART 1 UPPER LEFT
Source: Conference Board, University of Michigan, National Bureau of Economic Research. Notes: Blue-shaded areas denote recessions; orange-shaded area highlights current economic expansion. Consumer confidence fell sharply this month, suggesting that uncertainty over the Trump administration’s policies and stalling progress on inflation are weighing on households’ spirits. Both the closely followed Conference Board and U of M sentiment gauges tumbled. The former dipped by 7 points to 98.3 – the weakest reading since last April – while the latter fell by 6.4 points to a 15-month low of 64.7. In both canvasses, dampened expectations of prospective economic conditions were the primary driver of the reported declines. On the inflation front, respondents to the U of M survey anticipated consumer price inflation to rise by 4.3% over the next 12 month, while those in the Conference Board canvass expected a 6% jump on average, both exceeding the Fed’s desired 2% target by a country mile.
CHART 2 UPPER RIGHT
Source: Bloomberg. Top pane is yield (LHS, %); bottom pane is change (LHS, bps). As of Thursday close, the UST term curve was notably lower than the week prior, with all tenors 2-year-and-out lower by over 20 bps. Yields have fallen partly on a more risk-averse sentiment in the markets; indeed, the S&P 500 fell 1.55% on Thursday and is now -.35% year-to-date. In turn, the market’s pricing of potential Fed easing has changed notably. As of Thursday afternoon, the market prices end-2025 fed funds ~3.73%, or 22 bps lower than a week ago and which equates to ~2.4 25-bps Fed cuts. The market’s end-2026 forward is ~3.54%, or 33 bps lower than a week ago!
CHART 3 LOWER LEFT
Source: US Treasury, JP Morgan. Shown here is weekly net T-bill issuance (LHS, $bn) versus the Treasury’s General Account (TGA) balance (RHS, $bn). Year-to-date, T-bills outstanding have risen $271bn, as Treasury has utilized most of the $336bn in borrowing capacity created via extraordinary measures to manage under the debt limit. But now that borrowing headroom has decreased, and so net T-bill supply is expected to drop notably in the month(s) ahead. Indeed, absent an imminent debt ceiling resolution, JP Morgan expects ~$326bn of T-bill paydowns over the next ten weeks, thereby lowering T-bills outstanding below levels at the beginning of the year. Meanwhile, the TGA should decline by ~$511bn prior to April tax date and then recover thereafter. All else equal, a drop in T-bill supply could help contain short-end rate levels including on our paper. Notably, FHLB spreads already have moved to tighter levels, as is reflected in our SOFR-Floater advances. While some of this tightening may be due to recent upward pressures on SOFR, the steady demand (witness Money Market Funds high AUM levels) for short-end paper is also a factor. Our 3-month and 1-year advance spreads, for instance, are ~6 and 8 bps lower, respectively, than their past 3-year average.
CHART 4 LOWER RIGHT
Source: Bloomberg. As seen here, rates and option implied volatility (“vol”) have both notably declined year-to-date. The 5-year swap (Gold, LHS, %) has declined from ~4.28 to ~3.79 since mid-January. Vol, meanwhile, has trended lower since mid-January, as portrayed here by the 2-year into 3-year swaption measure (White, RHS, annual bps). We have covered potential reasons for these moves in recent editions, but it appears that a “waiting for clarity” and more risk-averse investor attitude has developed in response to the economic uncertainty surrounding tariff and economic policy. Note that a simultaneous decline in rates and vol, in tandem with a flat yield curve, serves to enhance the pricing of our “Fixed Rate with Cap” advance product. This product has garnered increased interest from those with liability-sensitive profiles and/or desiring stress test protection to higher rates. Please call the desk to learn more.
FHLBNY Advance Rates Observations
Front-End Rates
- Short-end rates, as of Thursday afternoon relative to a week prior, were 1 to 4 bps lower. The 5- and 6-month tenors led the move, as the market priced into the curve a higher probability and size for potential Fed rates cuts this year. Investor demand for short investments, meanwhile, has generally remained sturdy along with robust Money Market Fund AUM levels supporting our paper. Also helpful is that net T-bill supply is expected to turn negative in the month ahead, owing to debt ceiling dynamics, per color herein on the previous section.
- With the highlight likely to be Friday’s jobs report, the market will also monitor a busy slate Fed speakers in the upcoming week.
Term Rates
- The longer-term curve, generally mirroring moves in USTs and swaps, was significantly lower at Thursday’s close from the week prior. The 3- to 5-year sector declined by 24 to 27 bps to lead the move. The advance curve is notably flat through the 5-year point, with the 3-year actually a few bps lower than surrounding tenors. Kindly refer to the previous section for color on market dynamics and changes. We encourage members to engage with the Member Services Desk for current rate levels and market dynamics.
- On the UST term supply front, the upcoming week serves a reprieve from auctions. Note that UST auctions usually occur at 1pm and can occasionally spur volatility around that time. Please contact the Member Services Desk for further information on market dynamics, rate levels, or products.
Price Incentives for Advances Executed Before Noon: In effect as of Tuesday, September 5, 2023, the FHLBNY is pleased to now offer price incentives for advances executed before Noon each business day. These pricing incentives offer an opportunity to provide economic value to our members, while improving cash and liquidity management for the FHLBNY. For further details, kindly refer to the Bulletin.
Looking for more information on the above topics? We’d love to speak with you!
Archives
Questions?
If you wish to receive the MSD Weekly Market Update in .pdf format (includes FHLBNY rate charts) or to discuss this content further, please email the MSD Team.