Member Services Desk
Weekly Market Update
This MSD Weekly Market Update reflects information for the week ending February 21, 2025.
Economist Views
Click to expand the below image.
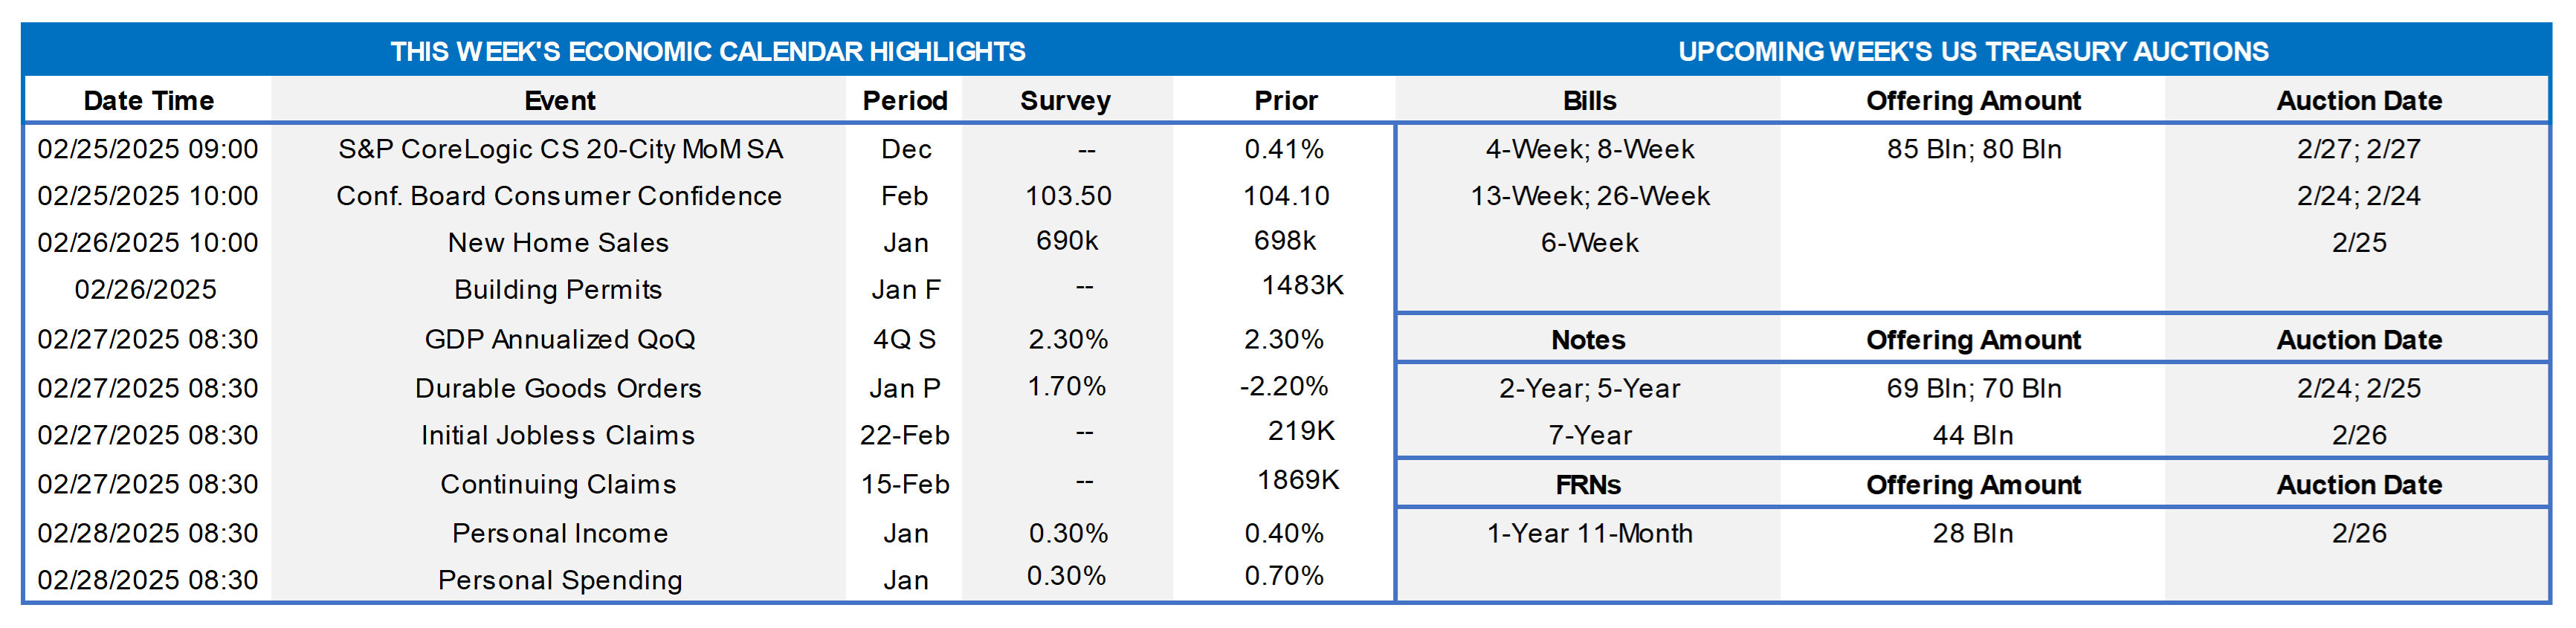
Market participants will contend with a crowded calendar of decidedly mixed economic releases in the upcoming week. Contracts to purchase a home likely rebounded at the end of last year, but prices received by sellers in major metropolitan areas slowed. Concerns about current economic conditions and prospects for the balance of 2025 probably weighed heavily on consumers’ spirits in February. Commercial aircraft bookings are expected to have propelled durable goods orders sharply higher in January. Labor market conditions likely remained tight in mid-February, setting the stage for a solid jobs report for this month. Roughly half a dozen Federal Reserve officials are scheduled to make public appearances this coming week.
S&P CoreLogic Case-Shiller 20-City Home Price Index: Home price increases probably slowed across the twenty major metropolitan areas canvassed by SPCLCS in December, rising by .2% after a .4% increase in November. If that projection is on the mark, the SPCLCS barometer rose by 4.2% last year, following a 6.4% gain over the course of 2023.
Conference Board Consumer Confidence: Preliminary soundings from the University of Michigan suggest that this gauge tumbled to a 2½-year low of 96.4 in February from 104.1 in the preceding month. Pay attention to the labor differential – the percentage of respondents believing that jobs are plentiful less those feeling positions are hard to get – for clues to any potential change in the civilian unemployment rate in the upcoming Bureau of Labor Statistics’ report.
New Home Sales: A reported decline in single-family housing starts suggests that contracts to buy a newly constructed dwelling declined by 4.8% to a 3-month low SAAR of 657K in January.
Real GDP Growth: Data released since the BEA’s advance estimate of Q4 real GDP growth hint at only a minor, if any, adjustment to the 2.3% annualized pace contained in last month’s report.
Durable Goods Orders: Powered by a commercial aircraft-led surge in transport equipment, orders probably jumped 5.4% in January, erasing the 4.1% decline of the final two months of 2024.
Pending Home Sales: Home purchase mortgage applications suggest that contract signings probably climbed by 2.2% in January, reversing roughly one-third of the 5.7% drop witnessed in December.
Jobless Claims: Labor market conditions likely remained healthy during the filing period ending February 22, with initial claims for unemployment insurance benefits remaining in a historically low 210K-225K band. The total number of persons receiving regular state benefits probably registered below 1.9mn once again during the week ended February 15.
Merchandise Trade Balance: Tariff-induced increases in imported goods purchases probably widened the deficit to a new record in January, after the $122bn shortfall posted at the end of last year.
Personal Income & Spending: Personal income probably expanded by .3% in January, after the .4% gain recorded in December. Capped by the already reported falloff in retail “control” purchases, consumer spending also likely rose by .3%, following the larger-than-expected .7% jump witnessed at the end of 2024.
Federal Reserve Appearances:
- Feb. 25 Dallas Fed President Logan to speak on “The Future of the Central Bank Balance Sheet” in London.
- Feb. 25 Richmond Fed President Barkin to give a speech on “Inflation Then and Now” at the Rotary Club of Richmond.
- Feb. 26 Atlanta Fed President Bostic to speak at the Urban Land Institute’s annual Housing Opportunity Conference.
- Feb. 27 Cleveland Fed President Hammack to give keynote address at the Research Conference on Bank Regulation in NYC.
- Feb. 27 Philadelphia Fed President Harker to give speech on the economic outlook at an event in Newark, Delaware.
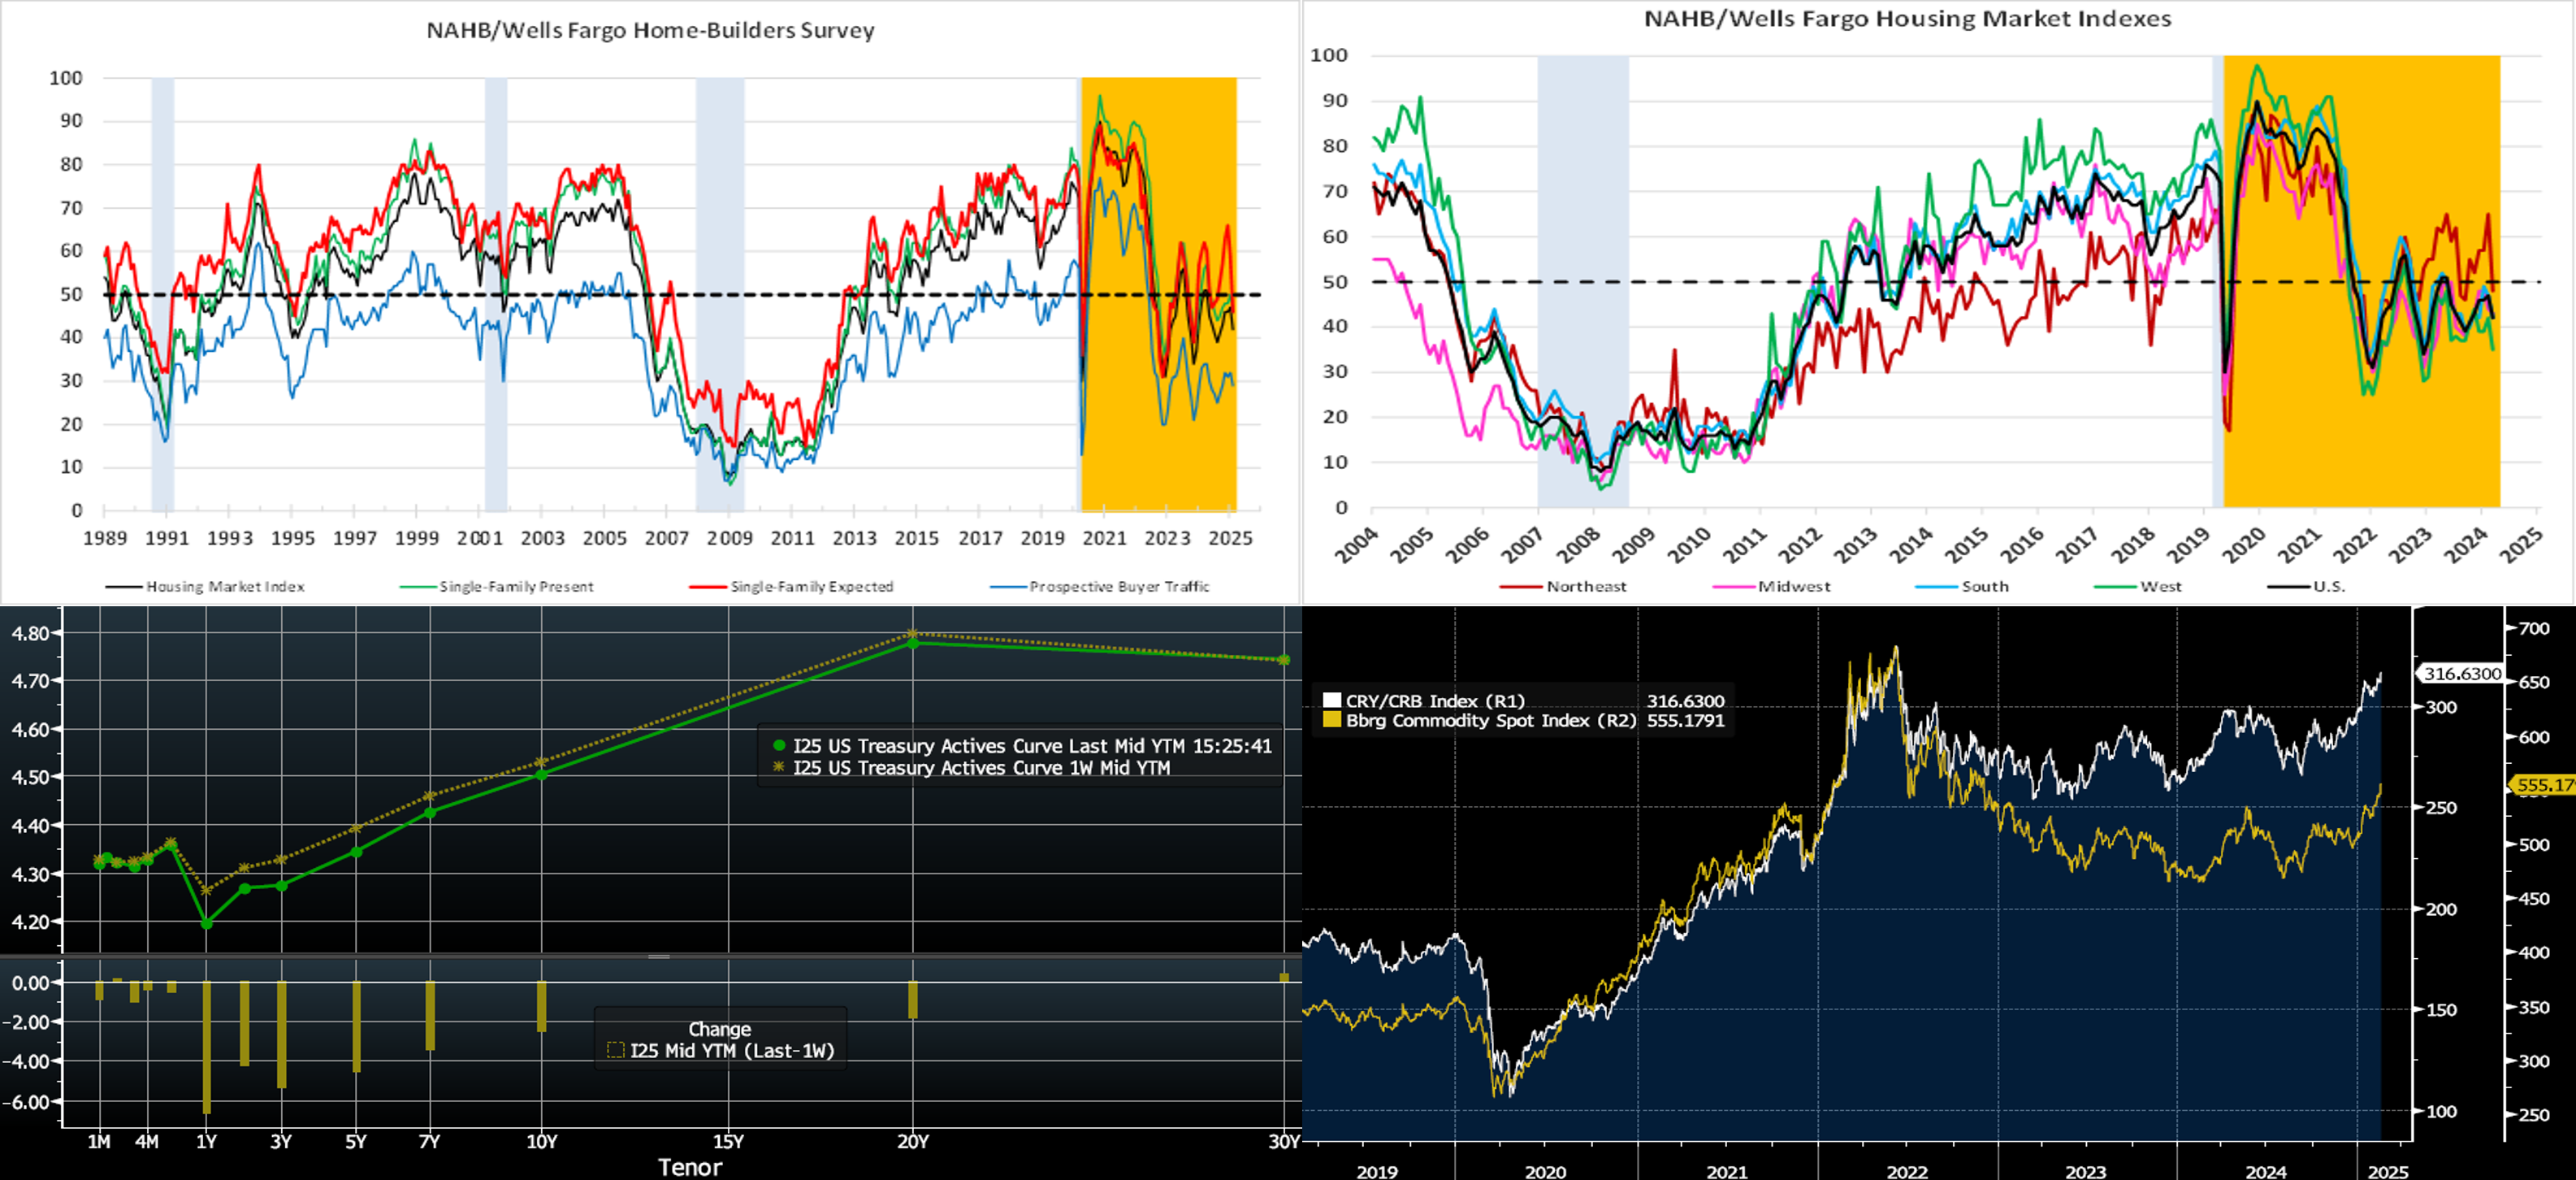
CHART 1 UPPER LEFT and CHART 2 UPPER RIGHT
Source: National Association of Home Builders/Wells Fargo; National Bureau of Economic Research. Notes: Blue-shaded areas denote recessions; orange-shaded areas highlight current expansion. The Housing Market Index – a composite gauge of homebuilders’ appraisals of current and future sales and prospective buyer traffic – retreated to a five-month low of 42 in February. While builders hold hope for pro-development policies from the Trump administration, particularly for regulatory reform, policy uncertainty, and cost factors prompted a reset of expectations this year. Builder confidence had surged following November’s election as contractors looked forward to less regulation and the prospect of more economic growth. However, the administration’s plans for tariffs on Canada and Mexico, delayed until at least March and a 10% levy already in effect on Chinese goods threaten to raise prices in an industry currently struggling to retain buyers. Indeed, with 32% of appliances and 30% of softwood lumber coming from international trade, tariff uncertainty has inspired builder concerns about costs. Moreover, with home prices near record highs nationwide and rates likely to remain elevated for the foreseeable future, incentives may be losing their power with a limited pool of eligible buyers. The shares of builders who cut prices or used sales incentives both declined in February. Builder sentiment in the Northeast, previously the rosiest, suffered the biggest drop during the reference period, plunging by 17 points to 48 – the biggest drop since April 2020 at the height of the global pandemic.
CHART 3 LOWER LEFT
Source: Bloomberg. Top pane is yield (LHS, %); bottom pane is change (LHS, bps). As of Thursday afternoon, the UST term curve was lower by 2 to 6 bps out to 10-year, with the very long end little changed, from a week ago. In the holiday-shortened week, the range in rates was relatively tight. The 5-year, for instance, traded between 4.30% and 4.41% and stood at 4.343% as of this writing. The dip in rates from the top of the range occurred on Wednesday afternoon after the release of the January 29th FOMC Minutes; therein, Fed members discussed a potential slowing or pause of the Fed’s balance sheet runoff. As of Thursday afternoon, the market prices end-2025 fed funds ~3.95%, or 7 bps lower than a week ago which equates to ~1.5 25-bps Fed cuts. The market’s end-2026 forward is ~3.87%, also 7 bps lower than a week ago.
CHART 4 LOWER RIGHT
Source: Bloomberg. This past week the Minutes from the January 29th FOMC were released, and the basic takeaway was that further rate adjustments are on pause until progress on inflation is clearer. Recent data have indicated that inflation embers have stubbornly remained in the economic mix. In that regard, commodity price indices, such as the CRY/CRB (Commodity Research Bureau) and Bloomberg Commodity Spot, both portrayed here, have notably risen by ~20% over the last six months. Many factors can influence the commodity and futures prices contained in these indices, namely supply/demand factors, economic growth projections, tariff and trade policies, supply chains, and weather. While Fedspeak has not made much mention of commodity pressures, the increases indicate that inflation embers have not been squelched. Indeed, the CRY index is approaching the past 5-year level of early to mid-2022 when the Fed commenced a dramatic hiking cycle.
FHLBNY Advance Rates Observations
Front-End Rates
- Short-end rates, as of Thursday afternoon relative to a week prior, were mostly unchanged through 4-month and then higher by 2 bps in the 5 and 6-month tenors. Investor demand for short investments, meanwhile, has generally remained sturdy along with robust Money Market Fund AUM levels supporting our paper. Net T-bill supply is expected to turn negative in the month ahead, owing to debt ceiling dynamics.
- The market will monitor a busier slate of economic data and Fedspeak in the upcoming week.
Term Rates
- The longer-term curve, generally mirroring moves in USTs and swaps, was 4 to 6 bps lower than last Thursday afternoon. The belly of the curve led the mild move, with the 5-year lower by 6 bps. The advance curve is notably flat, especially through the 3-year tenor. Kindly refer to the previous section for color on market dynamics and changes. We encourage members to engage with the Member Services Desk for current rate levels and market dynamics.
- On the UST term supply front, the upcoming week serves a slate of 2/5/7-year auctions. Note that UST auctions usually occur at 1pm and can occasionally spur volatility around that time. Please contact the Member Services Desk for further information on market dynamics, rate levels, or products.
Price Incentives for Advances Executed Before Noon: In effect as of Tuesday, September 5, 2023, the FHLBNY is pleased to now offer price incentives for advances executed before Noon each business day. These pricing incentives offer an opportunity to provide economic value to our members, while improving cash and liquidity management for the FHLBNY. For further details, kindly refer to the Bulletin.
Looking for more information on the above topics? We’d love to speak with you!
Archives
Questions?
If you wish to receive the MSD Weekly Market Update in .pdf format (includes FHLBNY rate charts) or to discuss this content further, please email the MSD Team.