Member Services Desk
Weekly Market Update
This MSD Weekly Market Update reflects information for the week ending January 31, 2025.
Economist Views
Click to expand the below image.
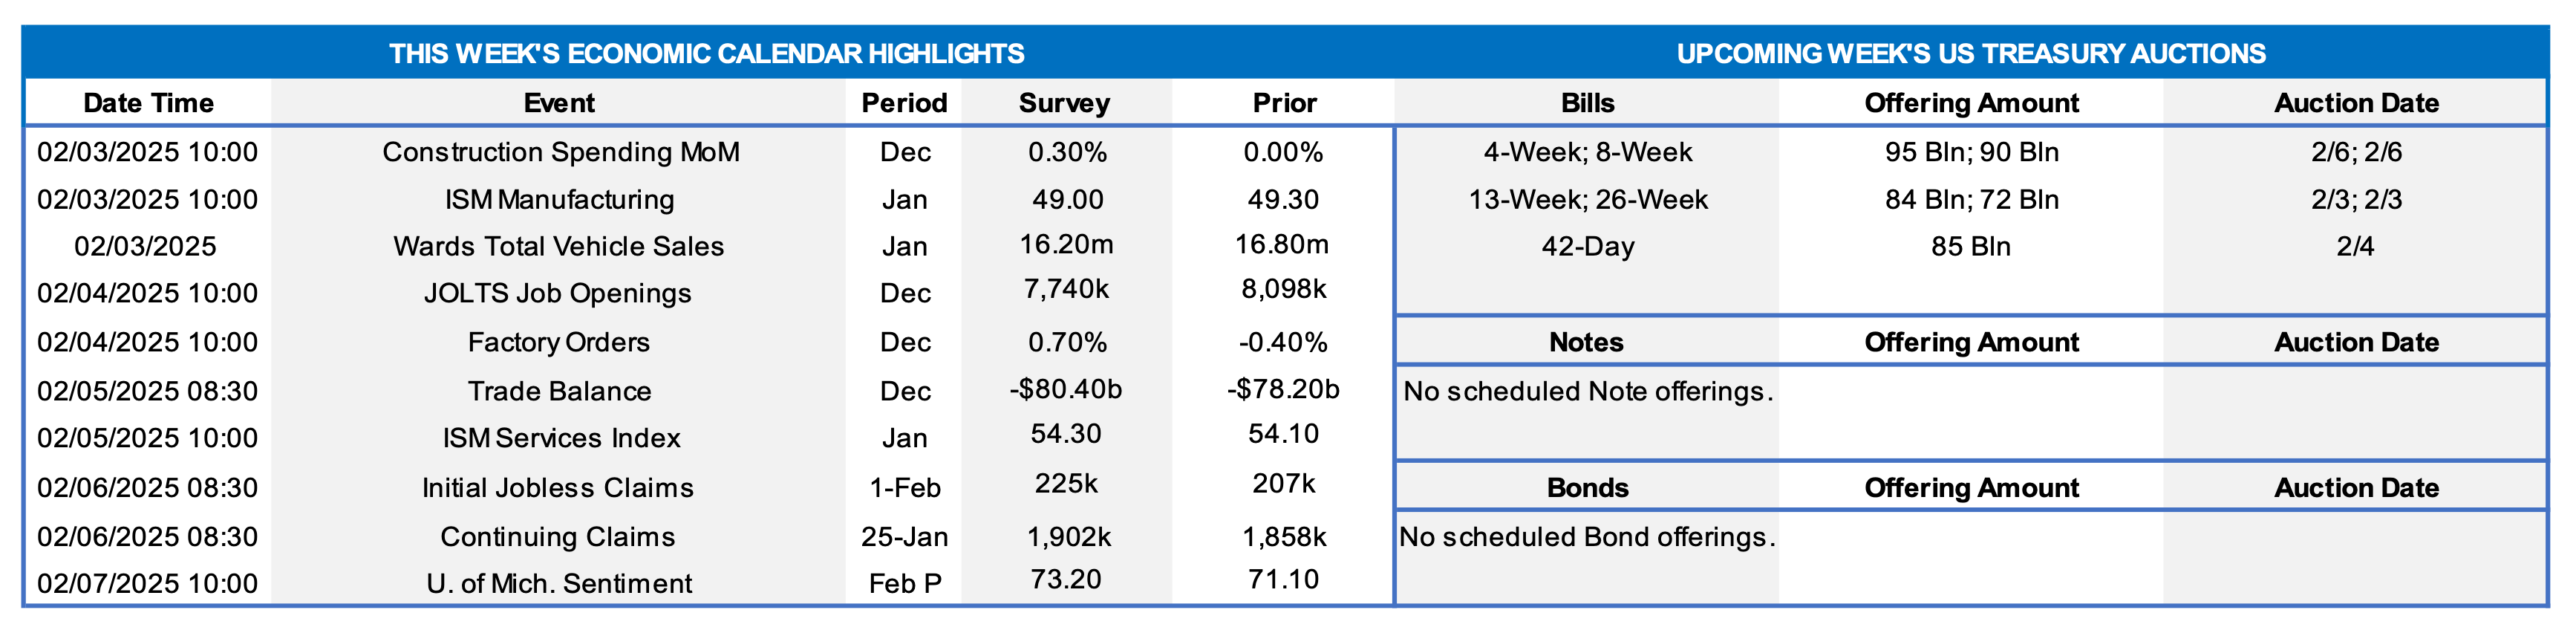
A busy calendar, along with a crowded slate of appearances by Federal Reserve officials, will be on offer this upcoming week. Purchasing manager reports likely will show that both manufacturing and service-producing activity expanded together for the first time in over two years. Bloated by the reported widening of the merchandise trade gap, the trade deficit is expected to hit a record high. Labor market conditions likely remained solid at year-start, although wildfires in California and scheduled annual revisions to the establishment survey make projections more uncertain than usual.
Construction Spending: The nominal value of new construction put-in-place likely climbed by .5% in December, after no change in the prior month.
ISM Manufacturing Activity Index: Available canvasses suggest that the closely followed activity gauge moved into expansionary territory for the first time since October 2022, with the headline gauge climbing to 51.2% in January from 49.2% in the preceding month.
Motor Vehicle Sales: Inclement weather conditions and wildfires, combined with less attractive dealer incentives, probably capped sales at 15.8mn annualized in January. While 6% below December’s 16.8mn tally, January’s projected level would be 5.3% above the 15mn recorded at the beginning of 2024.
JOLTS Job Openings: A reported decline in online help-wanted postings suggests that nationwide job openings contracted by 255K to 7.84mn in December, reversing all but a fraction of November’s surprising rise. At an estimated 957K during the reference period, the excess of vacant positions nationwide would represent 1.14 jobs per unemployed person.
Factory Orders: A tug-of-war between higher nondurables and a falloff in “hard” goods bookings probably left orders .7% lower in December after a downwardly revised .8% decline in November.
International Trade Balance: The widening of the merchandise trade deficit to a record $122.1bn in December suggests that the combined shortfall in international trade in goods and services leaped by $19.2bn to an all-time high of $97.4 bn at yearend.
ISM Service-Producing Activity Index: The expansion in activity probably narrowed at the beginning of 2025, with the barometer retreating to a seven-month low of 50.8% from 54% in December.
Employment Situation Report: Conditions probably remained tight at the beginning of 2025. Nonagricultural businesses likely added 190K net new workers in January, following the 256K gain witnessed in December. Weekly jobless claims reports hint that the civilian unemployment rate may have dipped to an eight-month low of 4% from 4.1% in the preceding month. With an extended five-week interval between establishment surveys, average hourly earnings probably climbed .4% higher after a .3% prior-month gain. If realized, that result would place nominal compensation 3.8% above the $34.51 per hour received at the beginning of 2024. The January report will include annual benchmark revisions of the establishment survey series on payrolls, earnings, and hours.
University of Michigan Consumer Confidence: Consumers’ appraisals of economic conditions probably changed little during the early portion of February from the January 71.1 reading.
Federal Reserve:
- Feb. 3 Atlanta Fed President Raphael Bostic to speak about the economic outlook at the Rotary Club of Atlanta.
- Feb. 3 St. Louis Fed President Alberto Musalem to give welcoming remarks at an event at the Bank.
- Feb. 4 Atlanta Fed President Raphael Bostic to speak about housing at a National Housing Crisis Task Force meeting.
- Feb. 5 Chicago Fed President Austan Goolsbee to give remarks at the Automotive Insights Symposium in Detroit.
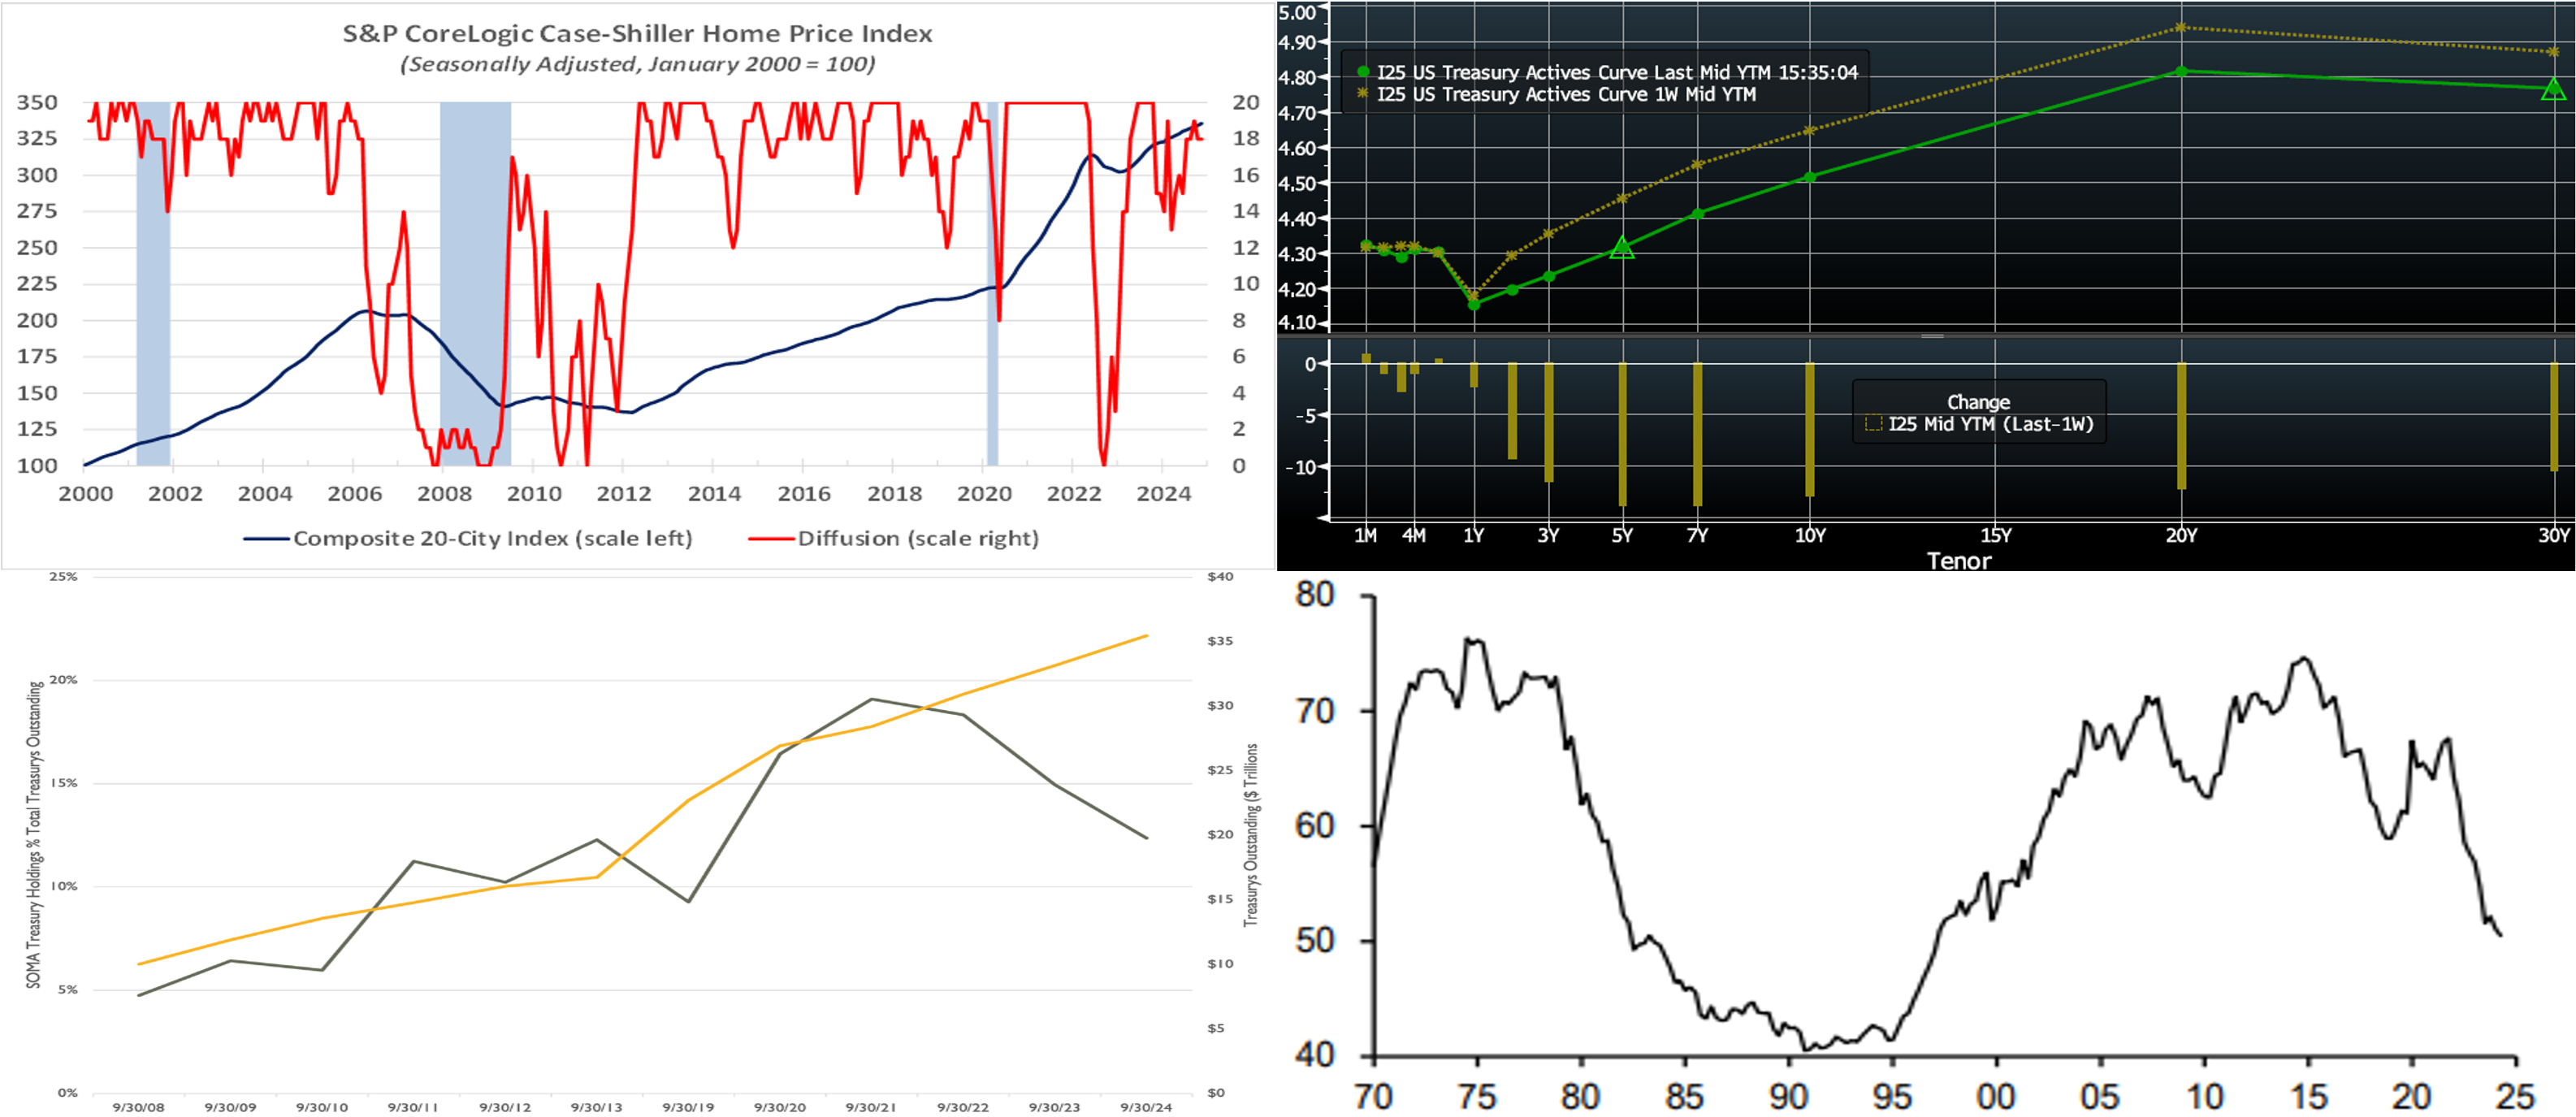
CHART 1 UPPER LEFT
Source: Standard & Poors; National Bureau of Economic Research; FHLB-NY. Note: Blue-shaded areas denote recessions. Home sales prices accelerated once again in November. The S&P CoreLogic Case-Shiller (SPCLCS) 20-City Home Price Index climbed by .4% during the reference period after a .3% gain in October. The breadth of sequential price increases was unchanged in November, with 18 of the metropolitan areas canvassed enjoying gains. The most recent rise left home prices 4.4% above those witnessed in November 2023. Closer to home, prices edged .3% higher across the New York City metropolitan area. While slightly lagging behind the average national increase, the 7.4% jump over the last 12 months was the largest among the surveyed cities.
CHART 2 UPPER RIGHT
Bloomberg. Top pane is yield (LHS, %); bottom pane is change (LHS, bps). As of Thursday afternoon, the UST term curve was lower by 2 to 16 bps, with the 3- to 10-year sector leading the decline. Since there was no specific catalyst for the decline, it appears that the steady move to higher yields over the past few months has now attracted demand from “real money” investors. The FOMC meeting was more of a “FOMZzzz”, as the Fed kept rates on hold and offered a generally neutral “wait-and-see” statement and conference. The upcoming week offers a slew of data, and the market will remain attuned to any announcements on federal tariffs/policies. As of Thursday afternoon, the market prices end-2025 fed funds ~3.85%, or ~6 bps lower than a week ago, which equates to slightly less than two 25-bps Fed cuts. The market’s end-2026 forward is ~3.855%, which is 9 bps lower than a week ago.
CHART 3 LOWER LEFT
Source: Federal Reserve; Fed H.4 Report; Treasury.gov; The Bank Treasury Newsletter. At this past Wednesday’s FOMC, the Fed maintained the current monthly UST runoff cap of $25bn and Agency debt and Agency MBS cap of $35bn, with any runoff exceeding those caps to be reinvested in USTs. Market strategists, at this juncture, maintain varied opinions on the timing of any possible cessation of this runoff, aka “Quantitative Tightening,” depending on the evolution of bank reserves and money market liquidity conditions this year. The Fed’s securities holdings, aka System Open Market Account (“SOMA”), have notably contracted not only in absolute terms but also relative to the size of the overall market. As seen here, SOMA UST holdings as a percentage (Black, LHS, %) of total UST debt outstanding (Gold, RHS, $trn) have declined to ~12% from ~19% three years ago.
CHART 4 LOWER RIGHT
Source: Federal Reserve; JP Morgan. Further on the above topic, shown here is the SOMA, US Commercial Bank, and foreign/international combined ownership share (LHS, %) of the UST outstanding debt market. This combined share has been falling in the last few years and now stands at ~50%, the lowest share since 1997. These investor types are generally less price-sensitive than others, such as institutional and hedge funds. This dynamic may persist in 2025 and thereby present some headwind to any concerted decline in longer-end UST yields; naturally, the course of economic growth, inflation, fiscal and tariff policy will all play a role in how strong a headwind this dynamic turns out to be in the year ahead.
FHLBNY Advance Rates Observations
Front-End Rates
- Short-end rates, as of midday Thursday, were modestly changed from a week ago, with the 1- to 6-month sector dipping a bp or two. The market has priced a slightly higher probability, relative to a week ago, of two 25-bps cuts in 2025. Meanwhile, investor demand for short paper has generally remained sturdy along with robust Money Market Fund AUM levels supporting our short-end paper.
- The market will monitor the heavy data and Fedspeak calendar in the upcoming week.
Term Rates
- The longer-term curve, generally mirroring moves in USTs and swaps, was 2 to 12 bps lower from last Thursday afternoon, led by the 3- to 10-year sector. Kindly refer to the previous section for color on market dynamics and changes. We encourage members to engage with the Member Services Desk for current rate levels and market dynamics.
- On the UST term supply front, the upcoming week serves as a reprieve from auctions. Note that UST auctions usually occur at 1pm and can occasionally spur volatility around that time. Please contact the Member Services Desk for further information on market dynamics, rate levels, or products.
Price Incentives for Advances Executed Before Noon: In effect as of Tuesday, September 5, 2023, the FHLBNY is pleased to now offer price incentives for advances executed before Noon each business day. These pricing incentives offer an opportunity to provide economic value to our members, while improving cash and liquidity management for the FHLBNY. For further details, kindly refer to the Bulletin.
Looking for more information on the above topics? We’d love to speak with you!
Archives
Questions?
If you wish to receive the MSD Weekly Market Update in .pdf format (includes FHLBNY rate charts) or to discuss this content further, please email the MSD Team.