Member Services Desk
Weekly Market Update
This MSD Weekly Market Update reflects information for the week ending January 24, 2025.
Economist Views
Click to expand the below image.
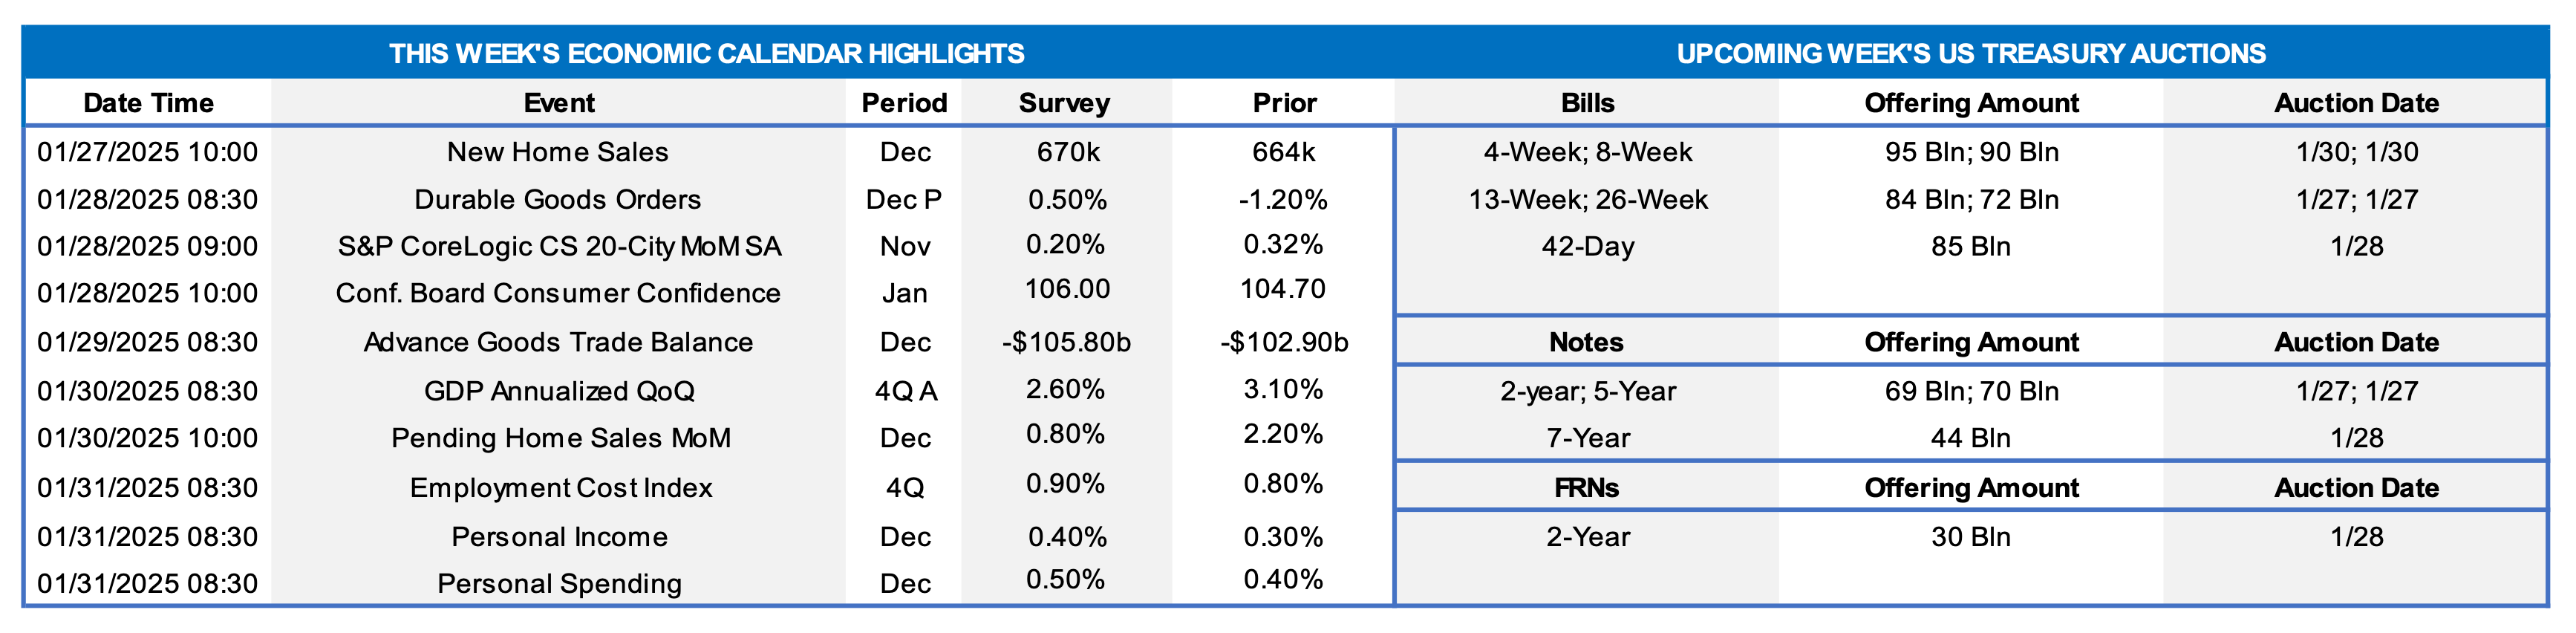
New Home Sales: Reported increases in single-family building permits and housing starts suggest that contracts to buy a newly constructed dwelling jumped by 3.9% to a 3-month high seasonally adjusted annual rate of 690K in December.
Durable Goods Orders: A tug of war between weaker transport equipment requisitions and other “hard” goods bookings probably left orders .8% lower in December, after a 1.2% dip in November.
S&P CoreLogic Case-Shiller (SPCLCS) 20-City Home Price Index: Home price increases probably continued apace across the twenty major metropolitan areas canvassed by SPCLCS in November, rising by .3% after a similar increase in October. That projection, if realized, would place the SPCLCS barometer 4.3% above the level posted 12 months earlier.
Conference Board Consumer Confidence: Preliminary soundings from the University of Michigan suggest that the Conference Board’s consumer sentiment gauge retreated to a four-month low of 103.5 in January from 104.7 in the preceding month. Pay attention to the labor differential – the percentage of respondents believing that jobs are plentiful less those feeling positions are hard to get – for clues to any potential change in the civilian unemployment rate in the upcoming Bureau of Labor Statistics’ report.
Merchandise Trade Balance: Driven by an anticipated jump in imports in advance of potential tariffs being levied on foreign goods, the merchandise trade deficit probably widened markedly in December from the $102.9bn shortfall witnessed in November.
Real GDP Growth: The Bureau of Economic Analysis’ advance estimate is expected to show that inflation-adjusted aggregate activity expanded at an above-trend annual rate of 2.6% during Q4, after a solid 3.1% annualized gain in Q3. As is common with government statisticians’ initial pass, the range of available forecasts is quite wide.
Pending Home Sales: Home purchase mortgage applications suggest that contract signings probably climbed by 1% in December, boosting the cumulative rise since July to 13.7%.
Employment Cost Index: Buoyed by a projected pickup in wage and salary growth, the BLS’ broadest measure of worker compensation probably climbed by 1% over Q4, following a .8% rise in Q3.
Personal Income & Spending: Stepped-up interest and dividend payments likely propelled personal income .4% higher in December, marginally eclipsing November’s .3% gain. Consumer purchases of goods and services probably quickened as well in the final month of 2024, climbing by .7% after a .4% prior-month rise.
Federal Reserve:
- Jan. 29 Federal Open Market Committee monetary policy decision; Fed Chair Jerome Powell to hold post-FOMC-meeting press conference.
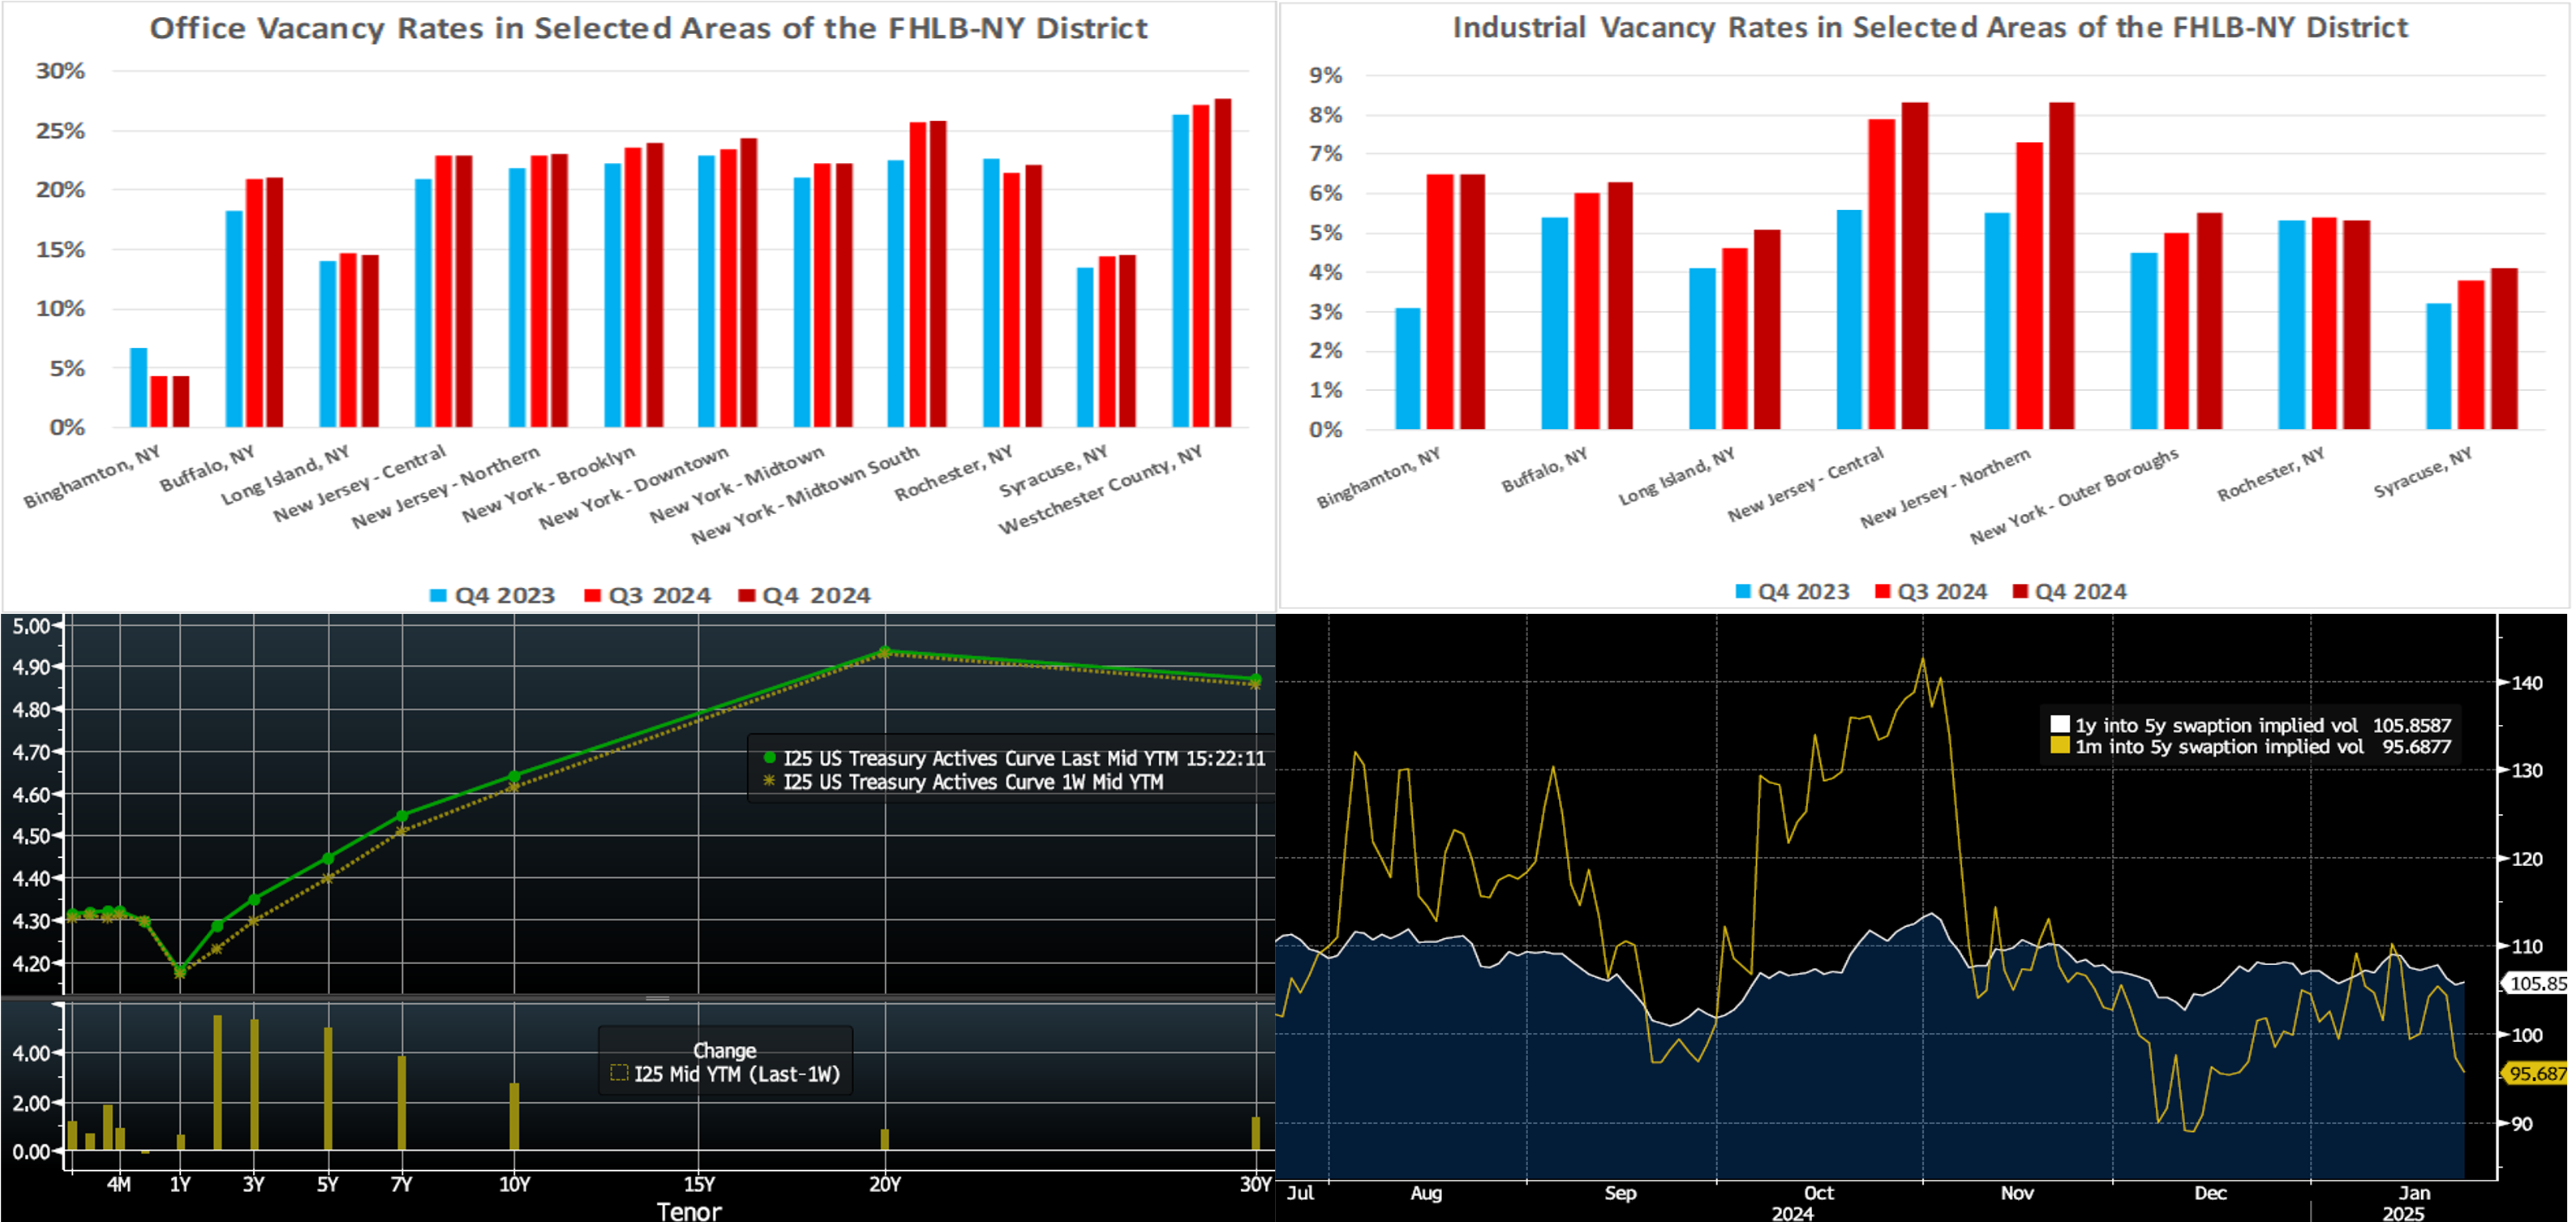
CHART 1 UPPER LEFT and CHART 2 UPPER RIGHT
Source: Cushman & Wakefield; FHLB-NY. Vacancy rates for commercial properties across the FHLB-NY coverage area generally moved higher during the final quarter of last year. The average vacancy rate for offices across sampled areas edged three ticks higher to 20.6% over the reference period, up from 19.4% during the fall of 2023. Notably, the average office vacancy rate in Manhattan registered at a record 24.1%, more than double the 10.5% recorded prior to the onset of the COVID-19 pandemic. With demand for industrial space cooling once again over Q4 2024, vacancy rates for industrial structures also climbed, ranging from a low of 4.1% in Syracuse, NY, to highs of 8.3% in Central and Northern NJ.
CHART 3 LOWER LEFT
Source: Bloomberg. Top pane is yield (LHS, %); bottom pane is change (LHS, bps). As of Thursday afternoon, the UST term curve was modestly higher from a week ago, with the 2- to 5-year sector ~5 to 6 bps higher leading the way. As of this writing, the holiday-shortened week was relatively uneventful rates, despite the change in the White House Administration. Rates remained in a narrow range, with the market likely awaiting more clarity and information on both the policy front and this upcoming week’s FOMC meeting. While the European Central Bank is expected to cut rates by 25 bps on January 30th, the Fed is expected to leave rates unchanged the day prior. As of Thursday afternoon, the market prices end-2025 fed funds ~3.94%, or 3 bps higher than a week ago, which equates to less than two 25-bps Fed cuts. The market’s end-2026 forward is ~3.96%, which is 4 bps higher than a week ago.
CHART 4 LOWER RIGHT
Source: Bloomberg. As noted above, the past week has experienced limited movement in rates, and this dynamic has been priced into option implied volatility measures (“vol”). As seen here, both 1-month-into-5-year (Gold, RHS, annual bps) and 1-year-into-5-year (White, RHS, annual bps) swaption vol has declined since the early November elections. Perhaps the lower “delivered vol,” i.e., actual moves in yields, in tandem with the market awaiting more clarity from the FOMC and new federal government administration, have conspired to prod vol lower for now. “For now” is the operative phrase, however, because the 1-year expiry vol has declined much less than 1-month, thereby indicating that the market expects higher actual volatility in rates in the months ahead. Currently, the 1-month expiry vol is 10.2 bps lower than the 1-year versus an average of 5.3 bps higher. At some point, sharp rate moves can be expected to ignite a rise in short-dated vol and perhaps opportunities along with it.
FHLBNY Advance Rates Observations
Front-End Rates
- Short-end rates, as of midday Thursday, were a few bps higher from a week ago; most tenors were up by a bp or two, in line with the general move in short-end markets. Investor demand for short paper, however, has generally remained sturdy and robust Money Market Fund AUM levels have supported our short-end paper.
- The market‘s focus will be on the FOMC outcome. The market will also monitor potential announcements from the new White House Administration.
Term Rates
- The longer-term curve, generally mirroring moves in USTs and swaps, was modestly changed from last Thursday afternoon, with most tenors a bp or so higher. Kindly refer to the previous section for color on market dynamics and changes. We encourage members to engage with the Member Services Desk for current rate levels and market dynamics.
- On the UST term supply front, the upcoming week serves 2/5/7-year auctions early in the week. Note that UST auctions usually occur at 1pm and can occasionally spur volatility around that time. Please contact the Member Services Desk for further information on market dynamics, rate levels, or products.
Price Incentives for Advances Executed Before Noon: In effect as of Tuesday, September 5, 2023, the FHLBNY is pleased to now offer price incentives for advances executed before Noon each business day. These pricing incentives offer an opportunity to provide economic value to our members, while improving cash and liquidity management for the FHLBNY. For further details, kindly refer to the Bulletin.
Looking for more information on the above topics? We’d love to speak with you!
Archives
Questions?
If you wish to receive the MSD Weekly Market Update in .pdf format (includes FHLBNY rate charts) or to discuss this content further, please email the MSD Team.